Specific Process Knowledge/Characterization/XRD/XRD SmartLab/ALD deposited alumina and titania XRR
Feedback to this page: click here
This page is written by Evgeniy Shkondin @DTU Nanolab if nothing else is stated.
All images and photos on this page belonges to DTU Nanolab.
The fabrication and characterization described below were conducted in 2019 by Sarah Elisabeth Hussein El Dib (s135170) and Evgeniy Shkondin, DTU Nanolab as a part of the master project in collaboration with the DTU Photonics Department. The XRR fitting results has been corrected in november 2021..
Purpose of the work
The work described below was conducted in 2019 by Sarah Elisabeth Hussein El Dib (s135170) and Evgeniy Shkondin, DTU Nanolab as a part of the master project in collaboration with the DTU Photonics Department. The XRR fitting results has been corrected in november 2021.
The prepared samples were investigated by X-ray Reflectivity (XRR) method. The idea is to investigate the initial growth of Al2O3 and TiO2 on conventional Si samples (with native oxide) and measure the thickness of the layers in the range of 1 to 10 nm, where Spectroscopic Ellipsometry can be limited.
The deposition of ultrathin layers (with thickness below 10 nm) is difficult to characterize with ellipsometry alone, because of the model complexity. The prepared samples consist of a thin ALD film, but in order to properly distinguish it, the native oxide and surface moisture (with adventitious carbon contamination) should be taken into account since whey both have thicknesses comparable to ALD ultra-thin layer. For this purpose, the XRR method was employed.
Page has been updated in January 2022 with minor densities correction.
Deposition characteristics
A sequence of samples has been made by deposition Al2O3 and TiO2 on flat natively oxidized Si (100) samples. The thickness setpoints were chosen to be 2, 4, 6, and 8 nm, and a number of cycles calculated from the published growth rates which were verified for thicker films (20-100nm).
Deposition of Al2O3
The standard recipe for deposition of Al2O3 on flat and high aspect ratio structures has been used.
Equipment: ALD-1
Recipe: AL2O3
Assumed deposition rate: 0.097 nm/cycle
Temperature: 200 oC
| TMA | H2O | |
|---|---|---|
| Nitrogen flow | 150 sccm | 200 sccm |
| Pulse time | 0.1 s | 0.1 s |
| Purge time | 3.0 s | 4.0 s |
Number of cycles: 20, 40, 60, 80 for 2nm, 4nm, 6 nm and 8 nm respectively.
Deposition of TiO2
The standard recipe for deposition of amorphous TiO2 on flat and high aspect ratio structures has been used.
Recipe: amorphous TiO2,
Equipment: ALD-2
Assumed deposition rate: 0.0385 nm/cycle
Temperature: 150 oC
| TiCl4 | H2O | |
|---|---|---|
| Nitrogen flow | 150 sccm | 150 sccm |
| Pulse time | 0.1 s | 0.1 s |
| Purge time | 4.0 s | 6.0 s |
Number of cycles: 52, 104, 156, 208 for 2nm, 4nm, 6 nm and 8 nm respectively.
X-ray reflectivity results
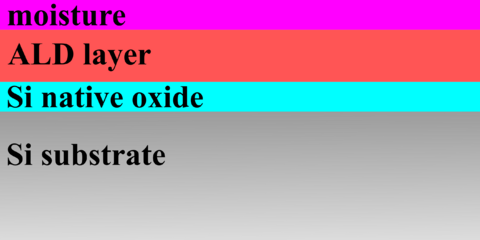
X-ray reflectivity (XRR) profiles for Al2O3 and TiO2 films at different number of cycles has been obtained using Rigaku XRD SmartLab equipment. The voltage and current settings for the Cu X-ray tube were standard 40kV and 30mA. The incident optics contained a Ge220x2 monochromator and 5 ° Soller slit. Other slits: IS=0.03mm RS1=0.03mm and RS2=0.032mm. Step size: 0.01 and measurement time - 10s for each point. Fitting procesure was performed using commercial GlobalFit software assuming the model based on Si substrate with native oxide followed by the deposited ALD layer with thin moisture surface. The results are summarized in a tables below.
- Sample model used in XRR analysis.
-
Sample considers to have ALD layer with top moisture deposited on natively oxidized silicon.
Si reference samples
Before the depositions of thin films, the Si samples has been analyzed with and without native oxide. It wil be used as a reference. Removing of native oxide has been done using 5% HF solution and rinsing with water. Results are shown below:
- All XRR scans.
-
Measuring Si reference sample with and without native oxide.
| Physical properties of Si reference sample with and without native oxide | |||||||||||||||||||||||||||||||||||||||||||||||||
| |||||||||||||||||||||||||||||||||||||||||||||||||
| Fitting of Delta and Beta values | |||||
|---|---|---|---|---|---|
| Sample | SiO2 | Si | |||
| Delta | Beta | Delta | Beta | ||
| Si without native oxide | - | - | 7.5796E-6 | 1.7601E-7 | |
| Si with native oxide | 6.2243E-6 | 8.1116E-8 | 7.5796E-6 | 1.7601E-7 | |
Thin films samples
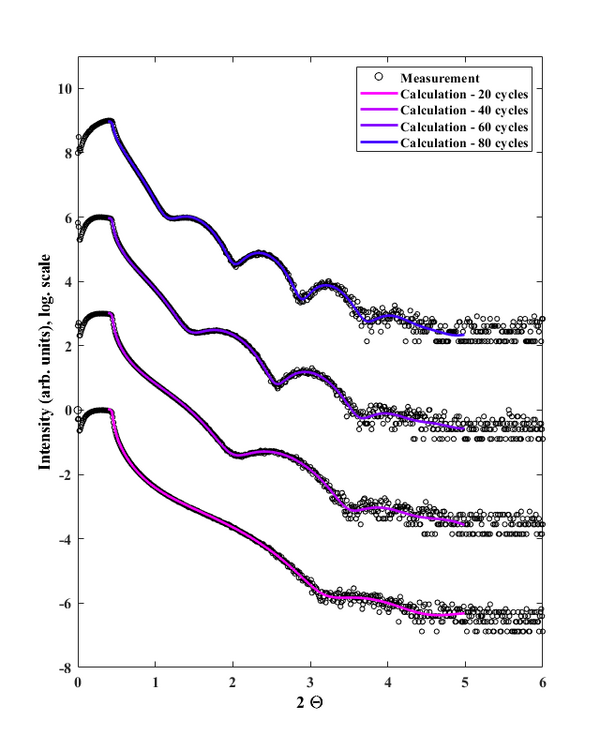
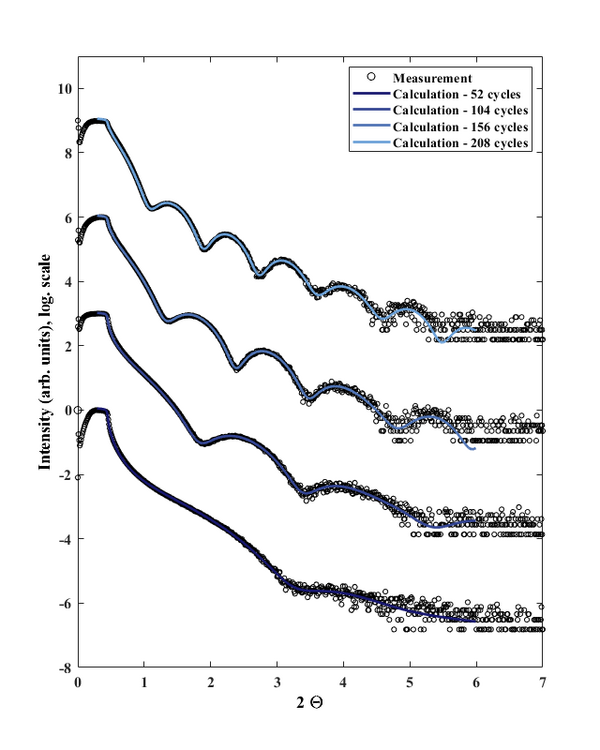
Below is an overview of all samples in total. XRR spectra are shifted in respect to each other in y-direction for better comparison. The reader can click on XRR Spectra for individual samples to see them in highere resolution.
- All XRR scans.
-
All Al2O3 samples scan.
-
All TiO2 samples scan.
Fitting resilts for Al2O3
| XRR results for Al2O3 layers | |||||||||||||||||||||||||||||||||||||||||||||||||||||||||||||||||||||||||||||||
| |||||||||||||||||||||||||||||||||||||||||||||||||||||||||||||||||||||||||||||||
| Fitting parameters | |||||||||||||
|---|---|---|---|---|---|---|---|---|---|---|---|---|---|
| Sample | Moisture | Al2O3 | Si native oxide | Si substrate | Fitting parameters | ||||||||
| Delta | Beta | Delta | Beta | Delta | Beta | Delta | Beta | Intensity | Background | Fitting area () | R | ||
| 20 cycles | 3.2291E-6 | 7.4986E-8 | 1.0491E-5 | 1.2221E-7 | 5.1604E-6 | 6.7251E-8 | 7.5796E-6 | 1.7601E-7 | 1.15165 | 4.1694E-7 | 0.3846 - 5.000 | 0.02218 | 0.01138 |
| 40 cycles | 5.9060E-6 | 1.3693E-7 | 9.1612E-6 | 1.0654E-7 | 6.8125E-6 | 8.8635E-8 | 7.5669E-6 | 1.7544E-7 | 1.11031 | 1.24726E-8 | 0.3714 - 5.000 | 0.02677 | 0.01663 |
| 60 cycles | 5.8344E-6 | 1.3527E-7 | 9.0960E-6 | 1.0578E-7 | 6.7815E-6 | 8.8233E-8 | 7.5669E-6 | 1.7544E-7 | 0.92337 | 2.27778E-7 | 0.3714 - 5.000 | 0.02671 | 0.01677 |
| 80 cycles | 6.0443E-6 | 1.4036E-7 | 9.4679E-6 | 1.1029E-7 | 6.8062E-6 | 8.8700E-8 | 7.5796E-6 | 1.7601E-7 | 0.98482 | 6.13396E-8 | 0.3714 - 5.000 | 0.02601 | 0.01598 |
Fitting resilts for TiO2
| XRR results for TiO2 layers | |||||||||||||||||||||||||||||||||||||||||||||||||||||||||||||||||||||||||||||||
| |||||||||||||||||||||||||||||||||||||||||||||||||||||||||||||||||||||||||||||||
| Fitting parameters | |||||||||||||
|---|---|---|---|---|---|---|---|---|---|---|---|---|---|
| Sample | Moisture | Al2O3 | Si native oxide | Si substrate | Fitting parameters | ||||||||
| Delta | Beta | Delta | Beta | Delta | Beta | Delta | Beta | Intensity | Background | Fitting area () | R | ||
| 52 cycles | 3.2558E-6 | 7.5605E-8 | 1.1697E-5 | 5.7265E-7 | 5.0270E-6 | 6.5513E-8 | 7.5796E-6 | 1.7601E-7 | 1.20038 | 8.88999E-9 | 0.3846 - 5.000 | 0.02639 | 0.01450 |
| 104 cycles | 2.5465E-6 | 5.9040E-8 | 1.0612E-5 | 5.1877E-7 | 6.9037E-6 | 8.9823E-8 | 7.5669E-6 | 1.7544E-7 | 1.12213 | 1.89786E-7 | 0.3846 - 5.000 | 0.01616 | 0.00516 |
| 156 cycles | 2.5465E-6 | 5.9040E-8 | 1.0527E-5 | 5.1462E-7 | 6.8032E-6 | 8.8515E-8 | 7.5669E-6 | 1.7544E-7 | 1.18524 | 6.07729E-8 | 0.3846 - 5.000 | 0.02059 | 0.00854 |
| 208 cycles | 3.5635E-6 | 8.2621E-8 | 1.0393E-5 | 5.0808E-7 | 6.6905E-6 | 8.7048E-8 | 7.5669E-6 | 1.7533E-7 | 1.21905 | 6.06500E-8 | 0.3846 - 5.000 | 0.01954 | 0.00725 |
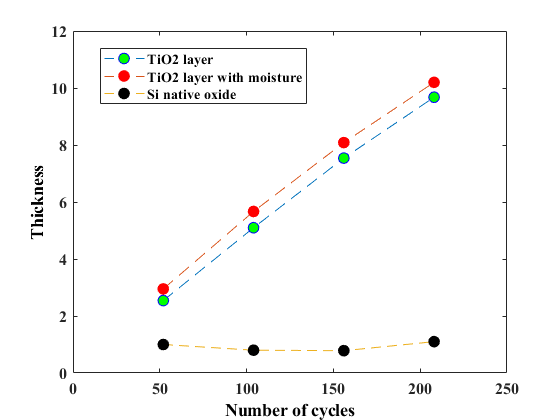
Graphical illustration of thickness dependence for Al2O3 and TiO2 ultrathin layers
- Deposition rate in the initial stage.
-
Al2O3 samples.
-
TiO2 samples.


