Specific Process Knowledge/Characterization/XPS/Processing/ALDSandwich1: Difference between revisions
| Line 13: | Line 13: | ||
= Data processing = | = Data processing = | ||
==== [[Specific Process Knowledge/ | ==== [[Specific Process Knowledge/Characterization/XPS/Processing/ALDSandwich1/1Open|1. Open the experiment and prepare processing grids]] ==== | ||
[[Specific Process Knowledge/Characterization/XPS/Processing/ALDSandwich1|Depth profile of ALD layers: Silicon wafer with 15 nm Al<sub>2</sub>O<sub>3</sub>, 15 nm of TiO<sub>2</sub> and 16 nm of HfO<sub>2</sub> ]] | [[Specific Process Knowledge/Characterization/XPS/Processing/ALDSandwich1|Depth profile of ALD layers: Silicon wafer with 15 nm Al<sub>2</sub>O<sub>3</sub>, 15 nm of TiO<sub>2</sub> and 16 nm of HfO<sub>2</sub> ]] | ||
Revision as of 09:52, 16 October 2018
XPS analysis of ALD deposited layers
This section assumes that you are familiar with the basic operations of data processing in Avantage. If not, then press HERE and go through this part first.
Guidelines on data processing
Click HERE to see some general guidelines on data processing in Avantage.
How to get the data used in the example below
The wiki does not allow uploading of *.zip data files so the zipped data file has been renamed to a *.xls file. Therefore, do the following:
- Download this File:Experiment 2.xls.
- Rename the downloaded file Experiment_2.xls to Experiment_2.zip
- Extract to a folder on a local drive (right click and select 'Extract all'). Avantage will not work on network drives.
Data processing
1. Open the experiment and prepare processing grids
Depth profile of ALD layers: Silicon wafer with 15 nm Al2O3, 15 nm of TiO2 and 16 nm of HfO2
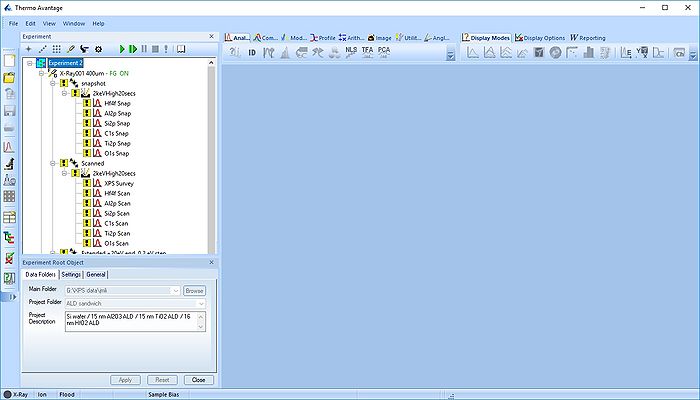
Double click on the Experiment 2.VGX file and Avantage should start. If you open from Avantage, remember to select 'All files *.*' to be able to find the *.VGX file.
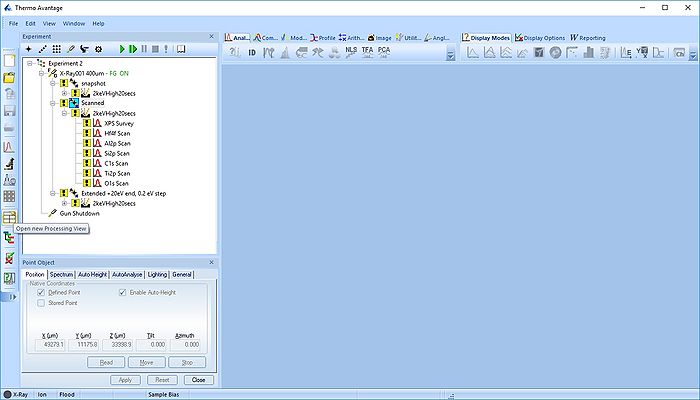
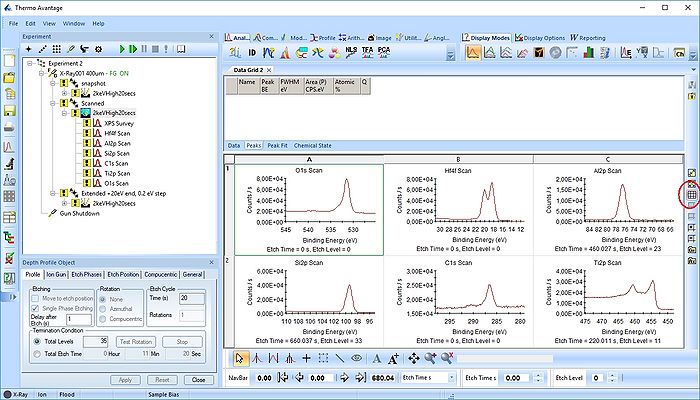
The experiment has three points. Here, we will process the data in the 'Scanned' point. Minimize the other points and open a new processing grid.
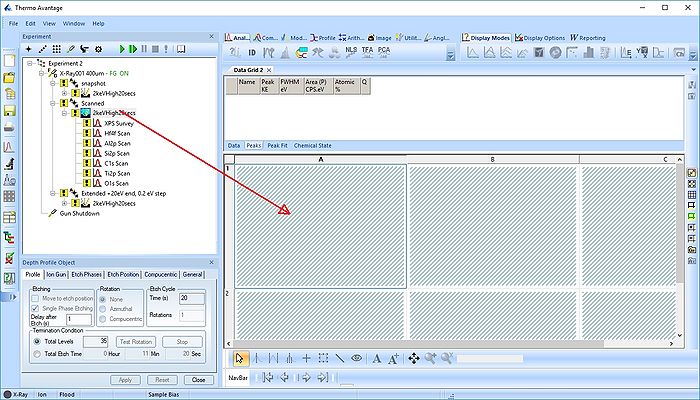
Click on the point in the experiment tree and drag the content into the processing grid.
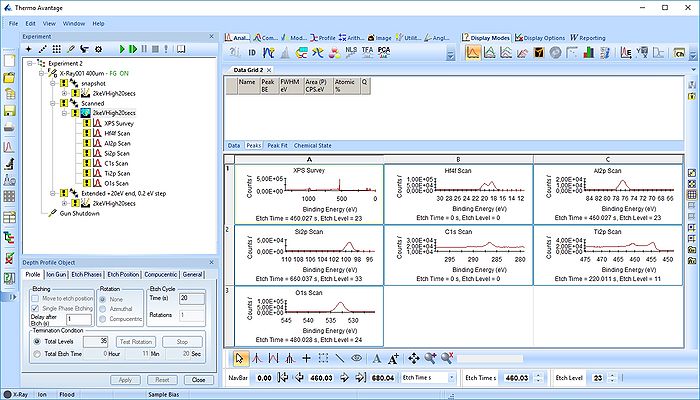
This action will create a grid with all spectra. Here, however, we will remove the survey spectrum from the processing grid by deleting it (keep in mind always to separate processing grids for survey spectra, scanned and snapshot spectra).
Rearrange the scanned spectra in the processing grid (Here called 'Data Grid2') with the button highlighted to the right.
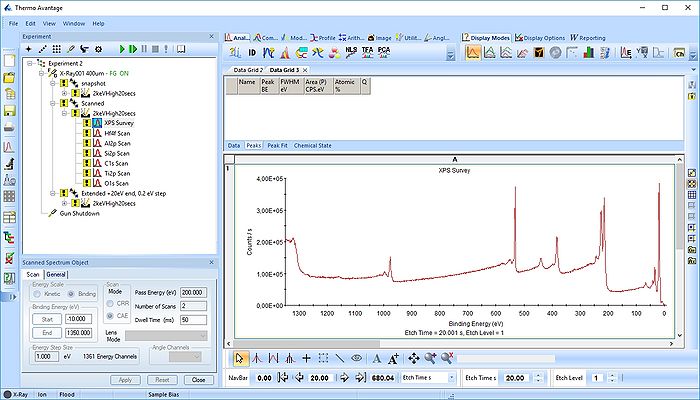
Open a new processing grid for the survey spectra, drag the spectra over there and remove the remaining empty grids. Here, the processing grid is called 'Data Grid3'.
Now, we have two processing grids ready for analysis.

