Specific Process Knowledge/Characterization/XPS/Processing/Basics: Difference between revisions
| Line 30: | Line 30: | ||
[[File:XPS-basics03.jpg|700px]] | [[File:XPS-basics03.jpg|700px]] | ||
== | == Different views of spectra == | ||
<span style="font-size: 90%; text-align: right;">[[Specific_Process_Knowledge/Characterization/XPS/Processing/Basics#top|Go to top of this page]]</span> | <span style="font-size: 90%; text-align: right;">[[Specific_Process_Knowledge/Characterization/XPS/Processing/Basics#top|Go to top of this page]]</span> | ||
| Line 41: | Line 41: | ||
If more levels (such as in a depth profile) are available, one can change the display mode: | If more levels (such as in a depth profile) are available, one can change the display mode: | ||
<gallery> | <gallery caption="Different views of spectra in experiments with several levels" widths="350" perrow="2"> | ||
Image:XPS-basics03display3.jpg | 2D Chart view | |||
Image:XPS-basics03display4.jpg | Stacked Chart view | |||
Image:XPS-basics03display1.jpg | 3D Chart view | |||
Image:XPS-basics03display2.jpg | Image view | |||
</gallery> | |||
== Survey spectrum peak identification == | |||
<span style="font-size: 90%; text-align: right;">[[Specific_Process_Knowledge/Characterization/XPS/Processing/Basics#top|Go to top of this page]]</span> | |||
</ | |||
In the top are several bottoms in the 'Analysis' toolbar. Click the leftmost one called Automatic Survey ID and a automated peak identification routine will commence. The result is shown below: | In the top are several bottoms in the 'Analysis' toolbar. Click the leftmost one called Automatic Survey ID and a automated peak identification routine will commence. The result is shown below: | ||
Revision as of 13:54, 8 September 2015
XPS data processing guide
This section shows all actions performed with Avantage (version 5.498) during an analysis of a sample.
Open data and save the processing document
Locate the .VGX file in the experiment data tree. Either open the experiment by selecting 'Open Experiment' in Avantage, or double click on the .VGX file. You will see something like this:

It is a very good idea to save the processing document as you analyze the data (Avantage may crash some times) - to do so, select 'Save Processing Document' and you analysis will be saved as a .VGD file.
Spectrum views
To start analysing the data we will start by looking at the survey spectrum. Open a new processing document by clicking the button in the toolbar to the left as shown below:

Then drag the survey spectrum into one of the quadrants in the data grid as shown below:

Use the buttons as shown to the right (or below the red square) to
- Maximize spectrum views
- Minimize spectrum views
- Add or remove rows/columns

Different views of spectra
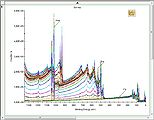
Maximize the view of the survey spectrum:

As shown in the bottom of the image above, this experiment holds several levels - the reason is that the exeriment is a depth profile in which a repeated set of spectra of a sample are recorded as the surface is gradually removed by an ion bombardment. Scroll through the individual levels, either by using the 'Etch time' or 'Etch Level' scroll buttons and see how the spectra change. Level 0 is the first spectrum.
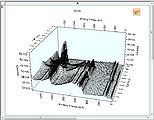
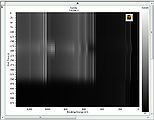
If more levels (such as in a depth profile) are available, one can change the display mode:
- Different views of spectra in experiments with several levels
-
 2D Chart view
 -
 Stacked Chart view
 -
 3D Chart view
 -
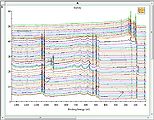 Image view


Survey spectrum peak identification
In the top are several bottoms in the 'Analysis' toolbar. Click the leftmost one called Automatic Survey ID and a automated peak identification routine will commence. The result is shown below:

Several things are worth noting:
- A peak table pops up above the spectrum. It contains information (which elements, fitted atomic percentages etc.) obtained in the automatic fitting routine. One can still scroll through the levels (if more levels in a depth profile are available) but the elements fitted will not change.
- Only a fraction of the peaks in the spectrum