Specific Process Knowledge/Characterization/XPS/XPS Chemical states: Difference between revisions
Created page with "=Chemical state= [[image:Si2p.JPG|420x420px|left|thumb|XPS Si2p spectrum of a Si reference sample (red curve), and a Si sample that was treated in HF shortly before the meas..." |
No edit summary |
||
| Line 2: | Line 2: | ||
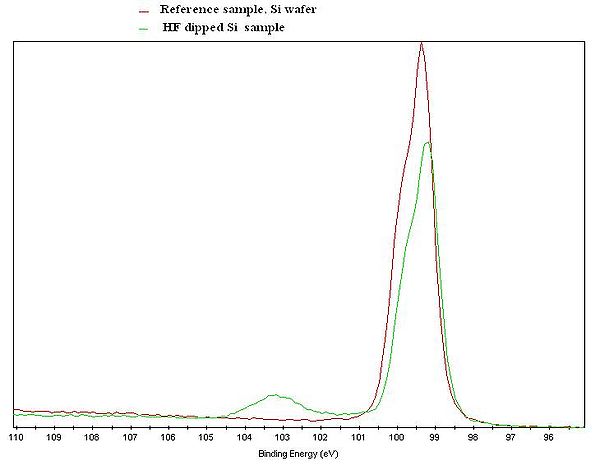
[[image:Si2p.JPG| | [[image:Si2p.JPG|600x600px|left|thumb|XPS Si2p spectrum of a Si reference sample (red curve), and a Si sample that was treated in HF shortly before the measurement was done (green curve). ]] | ||
Due to the so called chemical shift, it is possible to get information about the chemical state of the probed atoms. | Due to the so called chemical shift, it is possible to get information about the chemical state of the probed atoms. | ||
The core electrons of the atoms are affected, meaning that the binding energy of the electrons are slightly shifted, when an atom is bonded to atoms of other elements. | The core electrons of the atoms are affected, meaning that the binding energy of the electrons are slightly shifted, when an atom is bonded to atoms of other elements. | ||
Revision as of 16:06, 27 January 2014
Chemical state

Due to the so called chemical shift, it is possible to get information about the chemical state of the probed atoms. The core electrons of the atoms are affected, meaning that the binding energy of the electrons are slightly shifted, when an atom is bonded to atoms of other elements.
This gives an excellent tool for examining the chemistry of a surfaces, and how it is affected by different surface treatments.
The figure to the left gives an illustration of the effect. An XPS Si2p spectrum of a Si reference sample and a Si sample that was treated in HF shortly before the measurement, is clearly showing two different curves. The untreated spectrum has a clear feature at about 103 eV due to Si atoms bonded to oxygen. In the spectrum from the HF treated sample, only the feature steaming from Si-Si interaction is present. Note that both curves only shows the Si signal, but with an clear indication of the chemical state of the Si atoms in the samples.
If you study polymers, you can detect the presence of different chemical groups, for example (C-C),(C-OH),(C=O),(CF3) or (CF2-CH2) in the polymeric layer. And after surface treatments, you may examine differences in the polymeric layer.
Note that binding energies for different chemical states often can be found in the literature.
