Specific Process Knowledge/Etch/DRIE-Pegasus/picoscope: Difference between revisions
| Line 56: | Line 56: | ||
Process A has 4 second dep phase and 7 second (1.5 second break and 5.5 second main) and the SPTS Pro software samples the process parameters every 0.5 second. This produces plots as seen above where all measurements have markers. One can ask the questions: | Process A has 4 second dep phase and 7 second (1.5 second break and 5.5 second main) and the SPTS Pro software samples the process parameters every 0.5 second. This produces plots as seen above where all measurements have markers. One can ask the questions: | ||
# What happens if the cycle duration is lowered in order produce smaller scallops? | # What happens if the cycle duration is lowered in order produce smaller scallops? | ||
# | # How do we know if something that is very brief happens? For instance, spikes in reflected power can be rather short lived as indicated by the one point spikes of reflected coil power above. | ||
In both cases, the sampling frequency of 2 Hz is simply not high enough - we need to increase this. The SPTS Pro software can only lower this. However, realizing that all the devices (mass flow controllers, pressure gauges, RF generators etc.) responsible for the parameters in the plot above are produce output measurements in real time, we can sample these parameters by some external device. Enter the Picoscope oscilloscope with 8 analog channels that enable us sample up to 8 outputs, usually a DC voltage, at almost any sampling rate. We therefore have to decide which parameters are most important to monitor and then go through the electrical diagrams to find an appropriate place to pick up the signal. | |||
This set of parameters will | |||
Revision as of 11:37, 18 March 2020
Feedback to this page: click here
Process optimization using the Picoscope
Before going into details on why it makes sense to optimize the processes using the picoscope process monitoring, we need to have a look at how monitoring processes is usually done.
Standard process parameter monitoring
The original standard recipes on Pegasus 1 differ in many ways. The second step of one of them is listed below:
| Process A Step 2 parameters | ||
|---|---|---|
| Parameter | Etch | Dep |
| Gas flow (sccm) | SF6 350 (1.5 s), 550 | C4F8 200 |
| Cycle time (secs) | 7.0 | 4.0 |
| Pressure (mtorr) | 25 (1.5 s), 150 | 25 |
| Coil power (W) | 2800 | 2000 |
| Platen power (W) | 140 (1.5) 45 | 0 |
| Common | Temperature 20 degs | |
When running any recipe on the SPTS Pro software, a set of process parameters are recorded as the process runs. This data can be accessed later by looking up the datalog. Which parameters are recorded is dictated by the socalled logging recipe that is selected for every process recipe. The list of possible parameters to include in a logging recipe is long and is comprised of both input parameters such as 'Coil forward power demand' and 'SF6 flow setpoint', and measured values such as 'Platen temperature' and 'Platen DC Bias'. During the process itself, one can also activate the 'Trace' to monitor the process parameters in real time.
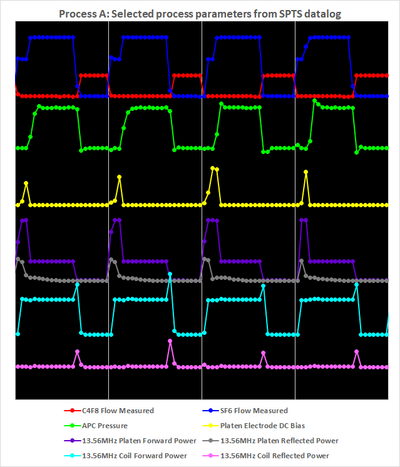
To the left in the figure below, some of the most important process parameters are shown for a process run of the recipe Process A.
- 4 cycles of Process A
-
 Left: Recorded with the SPTS software
 -
 Right: Recorded with the Picoscope


Above to the left, one can see the multiplexing of the Bosch process by alternation of the gas flows of SF6 (that has flow initially at 350 sccm in the break for the first 1.5 second then 550 sccm for 5.5 seconds in the main etch phase) and C4F8 (at 200 sccm in the dep phase) according to the process recipe table above. Below, the Pressure alternates between 25 mtorr (dep and break) and 150 mtorr (main). The Platen Electrode DC Bias (the electrostatic potential difference between the plasma and the wafer electrode that drives the ion bombardment in the etch process) is generated by the Platen Power at 140 W in the break and 45 W in the main etch. Below this, the Reflected Platen Power is not zero. The Coil Power is 2800 W (etch) and 2000W (dep) with the Reflected Coil Power below. The spikes in Coil Power at every point where the Reflected is not zero indicates that the Coil Power is running in Load mode (as opposed to Forward mode) where the power lost as reflected power is compensated for by increasing the input power.
Process A has 4 second dep phase and 7 second (1.5 second break and 5.5 second main) and the SPTS Pro software samples the process parameters every 0.5 second. This produces plots as seen above where all measurements have markers. One can ask the questions:
- What happens if the cycle duration is lowered in order produce smaller scallops?
- How do we know if something that is very brief happens? For instance, spikes in reflected power can be rather short lived as indicated by the one point spikes of reflected coil power above.
In both cases, the sampling frequency of 2 Hz is simply not high enough - we need to increase this. The SPTS Pro software can only lower this. However, realizing that all the devices (mass flow controllers, pressure gauges, RF generators etc.) responsible for the parameters in the plot above are produce output measurements in real time, we can sample these parameters by some external device. Enter the Picoscope oscilloscope with 8 analog channels that enable us sample up to 8 outputs, usually a DC voltage, at almost any sampling rate. We therefore have to decide which parameters are most important to monitor and then go through the electrical diagrams to find an appropriate place to pick up the signal. This set of parameters will
- 4 cycles of Process D4
-
 Left: Recorded with the SPTS software
 -
 Right: Recorded with the Picoscope


zx