Specific Process Knowledge/Characterization/XPS/Processing/ALDSandwich1/2Survey: Difference between revisions
Appearance
No edit summary |
|||
| Line 3: | Line 3: | ||
This analysis is continued from [[Specific Process Knowledge/Characterization/XPS/Processing/ALDSandwich1/1Open|'''here''']]. | This analysis is continued from [[Specific Process Knowledge/Characterization/XPS/Processing/ALDSandwich1/1Open|'''here''']]. | ||
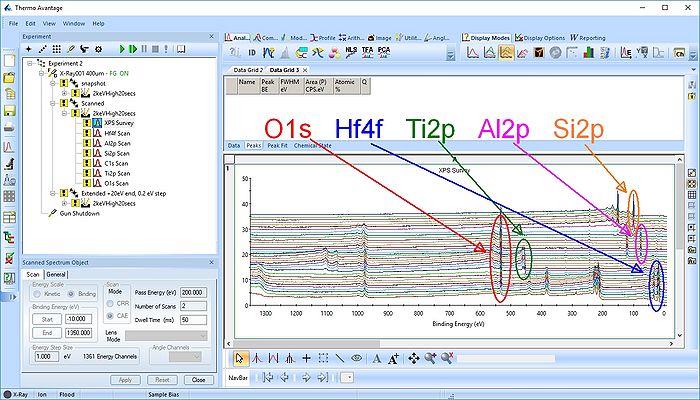
Under Display options select 'Stacked Chart View' as seen below. One can see that the peaks in the sandwich. | Under Display options select 'Stacked Chart View' as seen below. One can see that the peaks in the sandwich emerge and disappear as the depth profile progresses. Pressing the Automatic Survey ID button will therefore only identify | ||
[[File:ALD-Sandwich-15a.jpg|700px]] | [[File:ALD-Sandwich-15a.jpg|700px]] | ||
Revision as of 12:50, 16 October 2018
Survey spectrum processing
This analysis is continued from here.
Under Display options select 'Stacked Chart View' as seen below. One can see that the peaks in the sandwich emerge and disappear as the depth profile progresses. Pressing the Automatic Survey ID button will therefore only identify

