Specific Process Knowledge/Characterization/XPS/XPS elemental composition: Difference between revisions
Appearance
No edit summary |
|||
| Line 1: | Line 1: | ||
'''Feedback to this page''': '''[mailto:labadviser@danchip.dtu.dk?Subject=Feed%20back%20from%20page%20http://labadviser.danchip.dtu.dk/index.php?title=Specific_Process_Knowledge/Characterization/XPS/XPS_elemental_composition click here]''' | |||
=Elemental composition analysis= | =Elemental composition analysis= | ||
Revision as of 09:23, 18 February 2014
Feedback to this page: click here
Elemental composition analysis

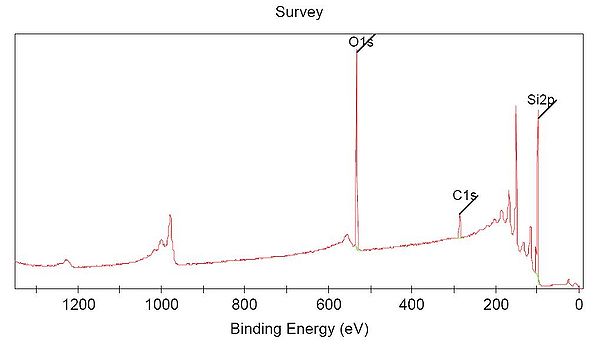
Each element give a specific "finger-print" in the XPS spectrum. The binding energy of the electrons in atoms are different for all elements, and when measuring a photoelectron spectrum over a wide range of energies, the main line from each element will be placed at a specific energy in the spectrum.
Here is shown a spectrum measured over the energy range 0-1350 eV, and characteristic lines from three elements (C,O and Si) are seen and indicated in the spectrum.
The instrument program can use this information to give an estimate of the sample composition, giving the atomic percentage of the different elements.
