LabAdviser/314/Microscopy 314-307/Technique/EELS: Difference between revisions
mNo edit summary Tag: Manual revert |
|||
| (11 intermediate revisions by 2 users not shown) | |||
| Line 1: | Line 1: | ||
'''Feedback to this page''': '''[mailto:labadviser@nanolab.dtu.dk?Subject=Feed%20back%20from%20page%20http://labadviser.nanolab.dtu.dk/index.php/LabAdviser/314/Microscopy_314-307/Technique/EELS click here]''' | '''Feedback to this page''': '''[mailto:labadviser@nanolab.dtu.dk?Subject=Feed%20back%20from%20page%20http://labadviser.nanolab.dtu.dk/index.php/LabAdviser/314/Microscopy_314-307/Technique/EELS click here]''' | ||
(''content by Shima Kadkhodazadeh, March 2020'') | (''content by Shima Kadkhodazadeh @DTU Nanolab, March 2020'') | ||
[[Category:314]] | [[Category:314]] | ||
[[Category:314-Microscopy]] | [[Category:314-Microscopy]] | ||
| Line 13: | Line 13: | ||
The fast electron beam can lose energy by exciting electrons in the outer or inner atomic shells of atoms to higher unoccupied energy states. Outer-shell single electron excitations can be seen as peaks at energies up to ~ 50 eV in the energy-loss spectrum. At higher energies the scattering intensity decreases according to a high power of the energy-loss and inner-shell electron excitations are seen as edges superimposed on this smoothly decreasing background (marked as ionisation edge in Fig. 1). In addition, the energy-loss spectrum can contain peaks corresponding to plasmon excitations. Plasmons can be excited within the specimen, i.e. a bulk plasmon, or at an interface, i.e. an interface plasmon. Plasmons generally occur in the range 5 – 30 eV, at energies higher than the band gap of the material. The first 50 eV of an energy-loss spectrum is usually referred to as the low-loss region. Higher energy-loss regions containing inner-shell ionisation edges are usually referred to as the core-loss region. | The fast electron beam can lose energy by exciting electrons in the outer or inner atomic shells of atoms to higher unoccupied energy states. Outer-shell single electron excitations can be seen as peaks at energies up to ~ 50 eV in the energy-loss spectrum. At higher energies the scattering intensity decreases according to a high power of the energy-loss and inner-shell electron excitations are seen as edges superimposed on this smoothly decreasing background (marked as ionisation edge in Fig. 1). In addition, the energy-loss spectrum can contain peaks corresponding to plasmon excitations. Plasmons can be excited within the specimen, i.e. a bulk plasmon, or at an interface, i.e. an interface plasmon. Plasmons generally occur in the range 5 – 30 eV, at energies higher than the band gap of the material. The first 50 eV of an energy-loss spectrum is usually referred to as the low-loss region. Higher energy-loss regions containing inner-shell ionisation edges are usually referred to as the core-loss region. | ||
<!-- | |||
== more detailed information == | |||
*[[LabAdviser/314/Microscopy 314-307/Technique/X-ray_spectroscopy/EDS-SEM|EDS-SEM with Oxford Aztec]] | |||
--> | |||
== relevant microscopes == | |||
*[[LabAdviser/314/Microscopy_314-307/TEM/T20|Tecani T20]] | |||
*[[LabAdviser/314/Microscopy_314-307/TEM/ATEM|Titan ATEM]] | |||
*[[LabAdviser/314/Microscopy_314-307/TEM/ETEM|Titan ETEM]] | |||
== literature == | |||
1. Carter, C. Barry, and David B. Williams. “Transmission Electron Microscopy: Diffraction, Imaging, and Spectrometry.” Springer International Publishing, 2016, doi:10.1007/978-3-319-26651-0. | |||
2. Egerton, R. F. “Electron Energy-Loss Spectroscopy in the Electron Microscope.” Electron Energy-Loss Spectroscopy in the Electron Microscope, Springer Science+Business Media, LLC, 2011. | |||
Latest revision as of 11:14, 9 September 2025
Feedback to this page: click here
(content by Shima Kadkhodazadeh @DTU Nanolab, March 2020)
Electron Energy-loss Spectroscopy (EELS)
EELS is the analysis of the energy distribution of the electron beam after interacting with and traversing a thin (typically < 100 nm) specimen. The transmitted electrons may have lost no energy (elastic scattering) or experienced energy loss due to inelastic scattering. An EEL spectrum represents the scattering intensity as a function of the energy-loss of the transmitted electron beam. Several interaction processes can cause the incident electron beam to lose energy and the energy to be transferred to the electrons or atoms in the specimen. There are four types of scattering mechanisms by which electrons can lose energy. These are: phonon scattering; plasmon scattering; single electron scattering; and radiation losses. Studying the energy-loss experienced by the electrons provides a wealth of important information about the chemistry and electronic structure of specimens, revealing information such as the chemical composition, local bonding, valence state, nearest-neighbour atomic structure, bandgap, complex permittivity function and specimen thickness. Fig. 1 is an example of an EEL spectrum. The most intense feature in an EEL spectrum is the zero-loss peak (ZLP), arising from the elastically scattered electrons. Although elastic scattering is defined as interactions in which no exchange of energy between the electron beam and the specimen occurs, in practice interactions by which the beam suffers an energy-loss below the energy resolution of the TEM instrument are also included in the ZLP.
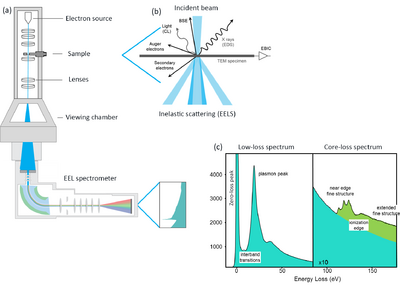
The fast electron beam can lose energy by exciting electrons in the outer or inner atomic shells of atoms to higher unoccupied energy states. Outer-shell single electron excitations can be seen as peaks at energies up to ~ 50 eV in the energy-loss spectrum. At higher energies the scattering intensity decreases according to a high power of the energy-loss and inner-shell electron excitations are seen as edges superimposed on this smoothly decreasing background (marked as ionisation edge in Fig. 1). In addition, the energy-loss spectrum can contain peaks corresponding to plasmon excitations. Plasmons can be excited within the specimen, i.e. a bulk plasmon, or at an interface, i.e. an interface plasmon. Plasmons generally occur in the range 5 – 30 eV, at energies higher than the band gap of the material. The first 50 eV of an energy-loss spectrum is usually referred to as the low-loss region. Higher energy-loss regions containing inner-shell ionisation edges are usually referred to as the core-loss region.
relevant microscopes
literature
1. Carter, C. Barry, and David B. Williams. “Transmission Electron Microscopy: Diffraction, Imaging, and Spectrometry.” Springer International Publishing, 2016, doi:10.1007/978-3-319-26651-0.
2. Egerton, R. F. “Electron Energy-Loss Spectroscopy in the Electron Microscope.” Electron Energy-Loss Spectroscopy in the Electron Microscope, Springer Science+Business Media, LLC, 2011.