Specific Process Knowledge/Characterization/XPS/Processing/ALDSandwich1/2Survey: Difference between revisions
No edit summary |
|||
| (5 intermediate revisions by the same user not shown) | |||
| Line 1: | Line 1: | ||
<!--Checked for updates on 24/8-2021. ok/ jmli--> | |||
<!--Checked for updates on 4/4-2025 - ok/jmli --> | |||
= Survey spectrum processing = | = Survey spectrum processing = | ||
| Line 31: | Line 34: | ||
In the automatic peak fitting routine, a background is added to the data below each peak. This background is then subtracted before the peak is fitted, it is shown with a light green color. It is clear that something goes wrong; the fitted background eats up the majority of the peak. The result is that the fitted Ti2p peak is much too small - then oxygen is seen as the only peak in the spectrum. | In the automatic peak fitting routine, a background is added to the data below each peak. This background is then subtracted before the peak is fitted, it is shown with a light green color. It is clear that something goes wrong; the fitted background eats up the majority of the peak. The result is that the fitted Ti2p peak is much too small - then oxygen is seen as the only peak in the spectrum. | ||
Judging by the way the background is fitted, it looks as if the software is programmed to fit the background below only the Ti2p<sub>3/2</sub> peak. The other part of the spin couple (the Ti2p<sub>1/2</sub> peak) is some 6 eV away on the | Judging by the way the background is fitted, it looks as if the software is programmed to fit the background below only the Ti2p<sub>3/2</sub> peak. The other part of the spin couple (the Ti2p<sub>1/2</sub> peak) is some 6 eV away on the higher binding energy side. Knowing that titanium will oxidize completely if oxygen is present we can expect only to see Ti<sup>4+</sup>. However, since the sputtering of the surface by Ar ions will usually act as mildly reducing, we can expect that intermediate oxidation steps of Ti will appear as the TiO<sub>2</sub> is sputtered. These intermediate states will cause the expected dip between the two peaks of the Ti2p(<sup>4+</sup>) spin orbit couple to disappear and the fitting of the background goes wrong. | ||
What to do about this? | |||
# Continue with the fitting of the high resolution scans - here we will have a much better chancer to work with the fitting of the peaks with intermediate oxidation steps. | |||
# Use a [https://xpssimplified.com/magcis_ion_system.php MAGCIS gas cluster ion source] instead in another instrument to avoid the reducing action of the Ar (single) ion source. | |||
The analysis continues [[Specific Process Knowledge/Characterization/XPS/Processing/ALDSandwich1/3scanned|'''here''']]. | |||
Latest revision as of 07:28, 4 April 2025
Survey spectrum processing
This analysis is continued from here.
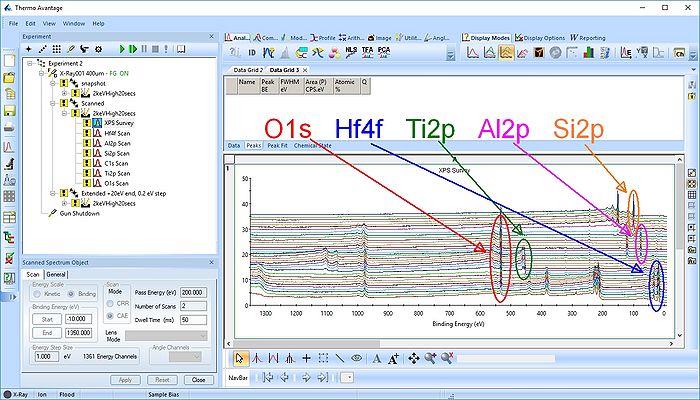
Under Display options select 'Stacked Chart View' as seen below. One can see that the peaks in the sandwich emerge and disappear as the depth profile progresses.
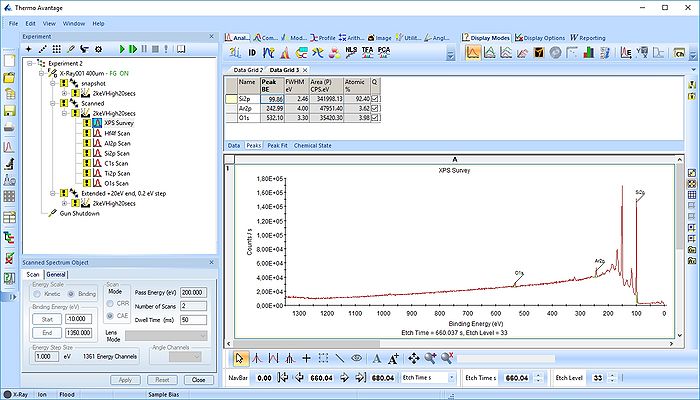
Pressing the Automatic Survey ID button will therefore only identify the elements present at each individual level. This is shown below for level 33.
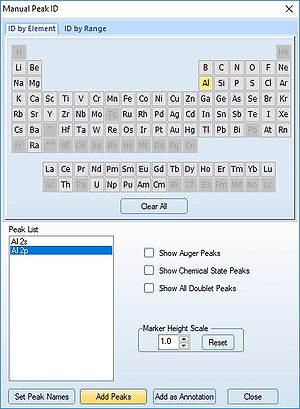
We therefore have to add the remaining peaks manually - this is done by pressing the 'ID' button. In the panel below, select the elements from the periodic table, highlight the peak as shown below with Al2p and press 'Add Peaks'.
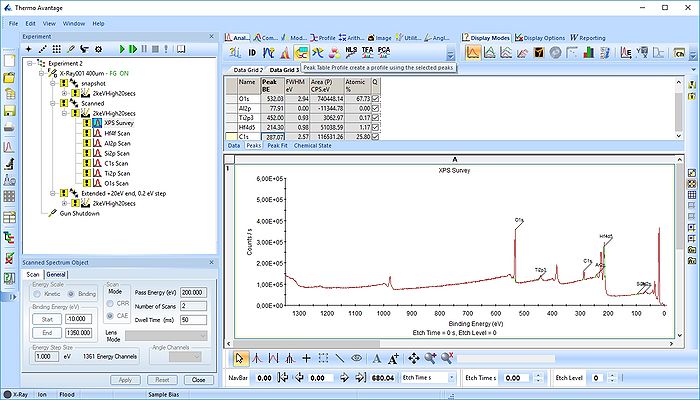
Once all the peaks have been added to the peak table, one can create a profile as shown below. Among the profile types choose 'Atomic %'.
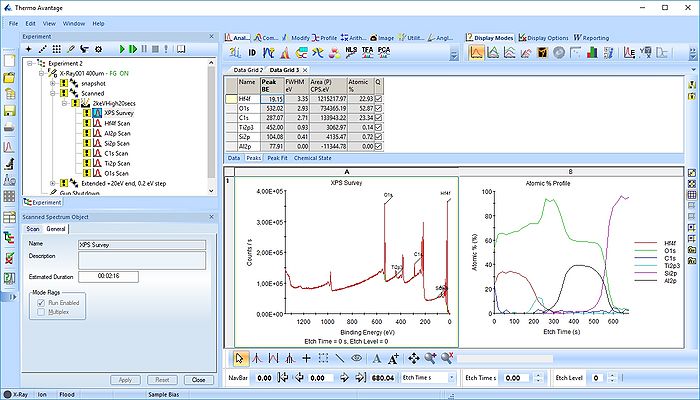
In the profile below there is one problem.
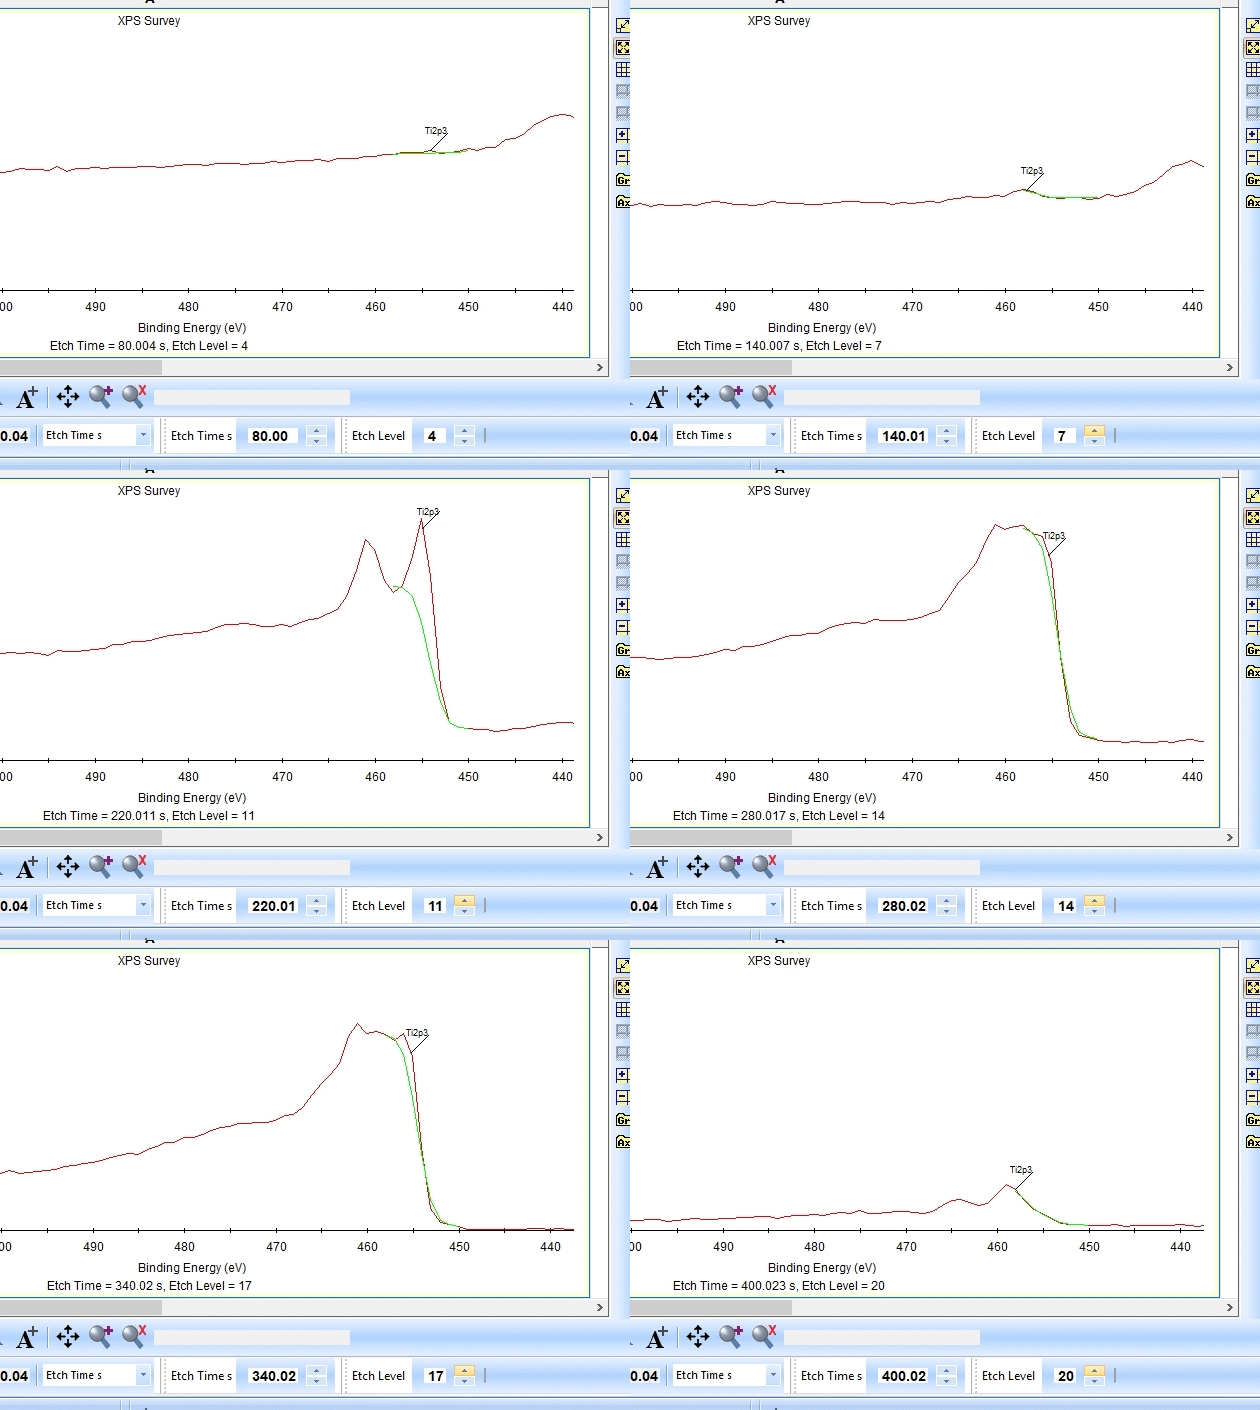
As seen above there is only a very small amount of Ti2p and at the same time the O1s is much too high. Why is this? Let us zoom in onto the Ti2p peak and see how the fitting goes.
In the gif file above one can see the etch level in the bottom center right.
In the automatic peak fitting routine, a background is added to the data below each peak. This background is then subtracted before the peak is fitted, it is shown with a light green color. It is clear that something goes wrong; the fitted background eats up the majority of the peak. The result is that the fitted Ti2p peak is much too small - then oxygen is seen as the only peak in the spectrum.
Judging by the way the background is fitted, it looks as if the software is programmed to fit the background below only the Ti2p3/2 peak. The other part of the spin couple (the Ti2p1/2 peak) is some 6 eV away on the higher binding energy side. Knowing that titanium will oxidize completely if oxygen is present we can expect only to see Ti4+. However, since the sputtering of the surface by Ar ions will usually act as mildly reducing, we can expect that intermediate oxidation steps of Ti will appear as the TiO2 is sputtered. These intermediate states will cause the expected dip between the two peaks of the Ti2p(4+) spin orbit couple to disappear and the fitting of the background goes wrong.
What to do about this?
- Continue with the fitting of the high resolution scans - here we will have a much better chancer to work with the fitting of the peaks with intermediate oxidation steps.
- Use a MAGCIS gas cluster ion source instead in another instrument to avoid the reducing action of the Ar (single) ion source.
The analysis continues here.

