Specific Process Knowledge/Thin film deposition/Deposition of MgO
Feedback to this page: click here
This page is written by Evgeniy Shkondin @DTU Nanolab if nothing else is stated.
All images and photos on this page belongs to DTU Nanolab.
The fabrication and characterization described below were conducted in 2021 by Evgeniy Shkondin, DTU Nanolab.
MgO Sputtering
This page presents the results of MgO deposition using RF sputtering in Sputter-System Lesker, now commonly known as "Old Lesker". The deposition target is MgO, and a small fraction of O2 has been added as a reactive gas to improve the stoichiometry. Source #5 (RF) was used.
The prepared samples were investigated using Spectroscopic Ellipsometry, X-ray Photoelectron Spectroscopy, and, most importantly, the X-ray Reflectivity method. The focus of the study was the deposition conditions and the analysis of the refractive index.
The process recipe in a Sputter-System (Lesker) is as follows:
- Deposition type: RF-R
- Power: 60 W.
- Pressure: 5 mTorr
- Gas: 2% of O2 in Ar
- Deposition time: 14400s, 28800s, 43200s, and 57600s which corresponds to 4, 8, 12, and 16 hours.
- Temperature: 20°C (no heating)
- Measured DC bias: fluctuates 36-48V
The characterization reveals a complex structure of the deposited layers. The best way to describe the samples is to implement the following model (shown in a figure). The MgO film contains a bottom intermediate layer with constant and relatively high electron density. On top of it, there is a main layer of MgO, where the density is a linear function of the depth. The highest density is on the bottom and the lowest at the top. The topmost layer contains moisture, where MgO binds carbon and water.
Appling this complexity allows fitting XRR data. Additionally, this structure is also supported by XPS analysis, where the chemical shifts of Mg 1s and O 1s support the idea.
The deposition rate derived from the XRR analysis, as illustrated in the figure, is based on thickness measurements that include the bottom intermediate layer, main layer, and moisture. This is a more reliable way of the procedure. Ellipsometry cannot take care of such complexity and ellipsometric measurement should only be used as a guide.
- Figure 1. Deposition rate and sample modeling.
-
 Deposition rate measured by ellipsometry and X-ray Reflectivity analysis.
 -
 MgO sample model.


Characterization
X-Ray Reflectivity
X-ray reflectivity (XRR) profiles for MgO films at four different deposition times (4h, 8h, 12h, 16h) has been obtained using Rigaku XRD SmartLab equipment with standard 2 / scans. The voltage and current settings for the Cu X-ray tube were standard: 40 kV and 30 mA. The incident optics contained an IPS (incident parallel slit) adapter with a 5 ° Soller slit. Other slits: IS=0.03mm, RS1=0.03mm, and RS2=0.075mm. Step size: 0.01 and measurement time - 5s for each point. The fitting procedure was performed using commercial GlobalFit software, assuming a model based on a Si substrate with a native oxide, followed by the deposited complex MgO film, as illustrated in the model figure. The results are summarized in a table below.
- Figure 2. XRR measurements and modelling.
-
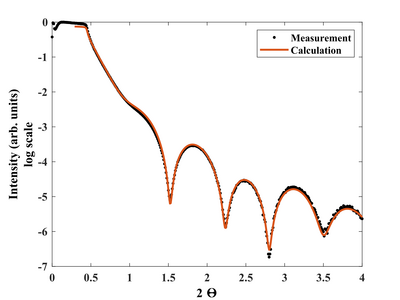 4 hours.
 -
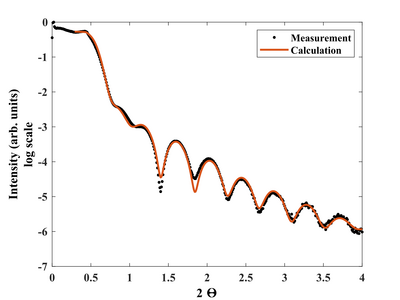 8 hours.
 -
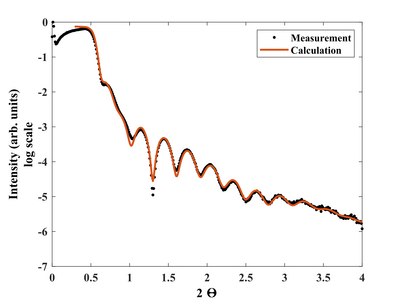 12 hours.
 -
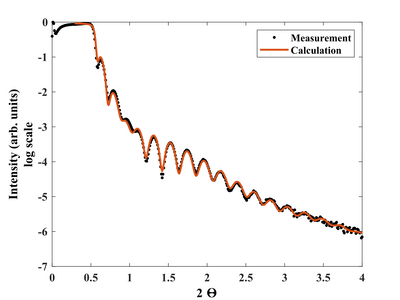 16 hours.


4 hours deposition summary table
| Layer parameter list | |||||||
|---|---|---|---|---|---|---|---|
| Layer name | Thickness (nm) | Density (g/cm3) | Rougness (nm) | Depth distribution | Bottom density (g/cm3) | Delta | Beta |
| Moisture | 4.64 |
1.04 | 0.00 | No distribution | 3.3961e-6 | 7.8861e-8 | |
| MgO | 5.12 |
2.57 | 1.25 | Linear | 4.83 | 8.2587e-6 | 8.5696e-8 |
| MgO intermediate layer | 2.75 |
2.79 | 3.05 | No distribution | 9.0818e-6 | 2.1089e-7 | |
| SiO2 native oxide | 1.81 | 1.40 | 0.58 | No distribution | 4.5656e-6 | 1.0602e-7 | |
| Si wafer | 2.33 | 0.74 | No distribution | 7.5795e-6 | 1.7601e-7 | ||
8 hours deposition summary table
| Layer parameter list | |||||||
|---|---|---|---|---|---|---|---|
| Layer name | Thickness (nm) | Density (g/cm3) | Rougness (nm) | Depth distribution | Bottom density (g/cm3) | Delta | Beta |
| Moisture | 4.71 |
1.12 | 0.56 | No distribution | 3.6587e-6 | 8.4960e-8 | |
| MgO | 13.54 |
2.64 | 1.55 | Linear | 4.42 | 8.4961e-6 | 8.8159e-8 |
| MgO intermediate layer | 1.93 |
3.26 | 2.52 | No distribution | 1.0606e-5 | 2.4629e-7 | |
| SiO2 native oxide | 2.07 | 1.83 | 0.40 | No distribution | 5.9538e-6 | 1.3826e-7 | |
| Si wafer | 2.33 | 0.24 | No distribution | 7.5795e-6 | 1.7601e-7 | ||
12 hours deposition summary table
| Layer parameter list | |||||||
|---|---|---|---|---|---|---|---|
| Layer name | Thickness (nm) | Density (g/cm3) | Rougness (nm) | Depth distribution | Bottom density (g/cm3) | Delta | Beta |
| Moisture | 5.23 |
1.03 | 0.92 | No distribution | 3.3640e-6 | 7.8117e-8 | |
| MgO | 18.03 |
2.44 | 1.85 | Linear | 3.77 | 7.8652e-6 | 8.1613e-8 |
| MgO intermediate layer | 5.54 |
3.58 | 0.15 | No distribution | 1.1652e-5 | 2.7058e-7 | |
| SiO2 native oxide | 2.39 | 2.22 | 0.21 | No distribution | 7.2460e-6 | 1.6826e-7 | |
| Si wafer | 2.33 | 0.02 | No distribution | 7.5795e-6 | 1.7601e-7 | ||
16 hours deposition summary table
| Layer parameter list | |||||||
|---|---|---|---|---|---|---|---|
| Layer name | Thickness (nm) | Density (g/cm3) | Rougness (nm) | Depth distribution | Bottom density (g/cm3) | Delta | Beta |
| Moisture | 4.57 |
1.04 | 1.02 | No distribution | 3.3747e-6 | 7.8365e-8 | |
| MgO | 30.01 |
2.66 | 2.07 | Linear | 3.84 | 8.5682e-6 | 8.8908e-8 |
| MgO intermediate layer | 4.99 |
3.62 | 0.63 | No distribution | 1.1785e-5 | 2.7366e-7 | |
| SiO2 native oxide | 2.18 | 2.12 | 0.44 | No distribution | 7.2018e-6 | 1.6724e-7 | |
| Si wafer | 2.33 | 0.02 | No distribution | 7.5795e-6 | 1.7601e-7 | ||
X-ray Photoelectron Spectroscopy
XPS profiles for MgO films has been obtained using XPS K-Alpha equipment. Here, only a 12h deposition sample is shown, but all samples look similar. Depth profiles have been acquired using monoatomic Ar+ bombardment. The etching time is 10s. A 3000 eV energy and high current setting is used.
- Figure 3. XPS analysis.
-
 MgO XPS Survey.
 -
MgO sample model.

Depth-profiles
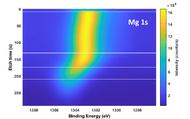
Depth profiles show chemical shifts of O-1s and Mg-1s peaks as a function of etch depth. The shape confirms the model presented in the figure of the model image, where the MgO thin film consists of a bottom intermediate layer, a main Layer with a linearly dependent density, and a topmost layer of moisture. This model is also successfully applied to XRR fitting.
- Figure 4. Depth-profile XPS analysis.
-
 Mg 1s. Surface and the first two etch levels only.
 -
 O 1s. Surface and the first two etch levels only.
 -
 Si 2p. Surface and the first two etch levels only.
 -
 C 1s. Surface and the first two etch levels only.
 -
 Mg 1s. Total depth.
 -
 O 1s. Total depth.
 -
 Si 2p. Total depth.
 -
 C 1s. Total depth.


Spectroscopic Ellipsometry
The spectroscopic ellipsometry measurements were conducted using a VASE Ellipsometer. The purpose of the investigation is to see how the change in thickness affects the shape of the refractive index. Other parameters, such as layer thickness, were also extracted.
The Cauchy layer is a commonly used layer for determining the optical constants of transparent or semitransparent films (Dielectric or Semiconductors below the fundamental bandgap). Over part of the spectral range, the optical constants of these materials can be represented by an index that varies slowly as a function of the wavelength and the exponential absorption tail. The index of refraction of the Cauchy layer is represented by an inverse power series containing only even terms, and a simple exponential tail represents the extinction coefficient.
There are three terms (A, B, and C) for the index of refraction (n), and there are three additional terms to describe an Urbach absorption tail. The k Amplitude and exp (Exponent coefficient) are fit parameters for determining the shape of the extinction coefficient dispersion. The BandEdge parameter can be set manually, but it is not a fitting parameter since it is directly correlated with the k Amplitude parameter (the extinction coefficient equals k Amplitude at the band edge). Here, the BandEdge=400nm
Below there is a table that shows the ellipsometry fitting result, assuming the Cauchy dispersion.
| Layer parameter list | |||||||
|---|---|---|---|---|---|---|---|
| Sample name | A | B | C | k | exp | Thickness | Roghness |
| 4 hours | 1.185 | 0.01476 | -0.00012589 | 0.01666 | 0.903 | 19.70 |
3.89 |
| 8 hours | 1.437 | 0.02146 | -0.00032685 | 0.00286 | 0.764 | 25.39 |
3.85 |
| 12 hours | 1.475 | 0.01990 | -0.00031736 | 0.02060 | 0.207 | 35.52 |
3.82 |
| 16 hours | 1.572 | 0.01553 | -0.00021398 | 0.00479 | 0.833 | 42.04 |
2.96 |
- Figure 5. Uniformity of deposited MgO layer accros 4-inch wafer.
-
 12h deposition sample.

Optical functions
- Figure 6. Modeling of the refractive index.
-
 Refractive index for the films with different thicknesses.
