Specific Process Knowledge/Thin film deposition/Deposition of Aluminium/Al Ebeam evaporation in Temescal
Feedback to this page: click here
This page is written by Evgeniy Shkondin @DTU Nanolab if nothing else is stated.
All images and photos on this page belongs to DTU Nanolab.
The fabrication and characterization described below were conducted in 2019 by Evgeniy Shkondin, DTU Nanolab.
Deposition characteristics
This page presents the results of Al deposition using PVD e-beam evaporator (Temescal). In total 5 samples with deposition rates 2, 4, 6, 8 and 10 Å/s was prepared. Samples were investigated by X-ray Photoelectron Spectroscopy (XPS), X-ray Reflectivity (XRR) and Scanning Electron Microscopy (SEM).
Deposition setpoints
| Deposition setpoints | |||||||||||||||||||||||||||||||||||||
|
|
Monitoring of Power and Deposition rate
After each deposition a specific file that contains all monitored parameters is saved with the given name. At the page below, the monitored values for deposition rate and power is presented. The depicted data illustrate the range between the end of "SOAK 2" phase and monitored deposition and the feed power at the end.
Fluctuations of power and deposition rate during the Al e-beam evaporation (Temescal)
XPS analysis
XPS profiles for Al films has been obtained using XPS K-Alpha equipment. No difference in chemical composition is observed in the Al films prepared at different deposition rates. Here, only the analysis results of 2 Å/s film are shown.
- XPS results.
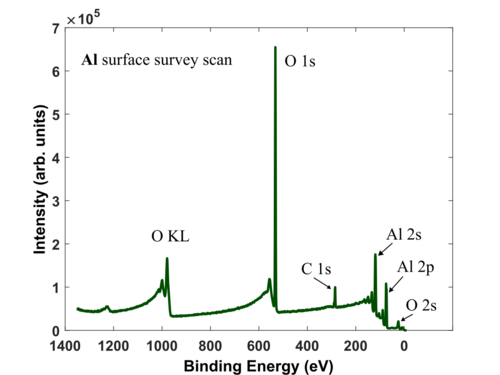
Survey scan of Al thin film with native oxide. No Ar+ sputtering applied. Substrate: Silicon 4" wafer with native oxide.

Survey scan of Al thin film after 190 s. Ar+ sputtering. Substrate: Silicon 4" wafer with native oxide.

High resolution Al 2p signal during the depth profiling. Ar+ sputtering proceeds from 0 to 190 s, with 10 s. interval with mid-current and energy of 3000 eV. At the surface, the Al peak is doubled due the bonding to oxygen and bonding to Al. After the etching the peak responsible to oxygen bonding becomes neglible. Substrate: Silicon 4" wafer with native oxide.

High resolution of C 1s signal. At the surface native airborne carbon can be observed, the signal disappears immediately after the ion beam is turned on. Substrate: Silicon 4" wafer with native oxide.

High resolution of O 1s signal. The signal is obviously strong at the beginning, since the top layer is composed of Al2O3, but it never completely disapears, but it becomes saturated, which means that some level of oxygen is always present in the main target. Substrate: Silicon 4" wafer with native oxide.


X-ray reflectivity results
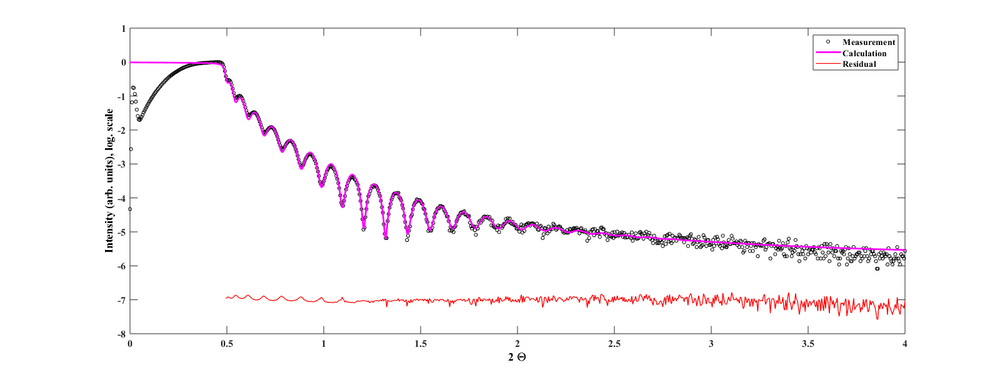
X-ray reflectivity (XRR) profiles for Al films at different deposition rates has been obtained using Rigaku XRD SmartLab equipment. Fitting procesure was performed using commercial GlobalFit software assuming the model based on Si substrate with native oxide followed by the deposited Al layer with thin oxidized surface. The results are summarized in a table below. The general trend is that the higher deposition rates produces smoother films. Indeed, at deposition rate of 10Å/s the characteristic Kiessig fringes are visible even at above 30, which indicates the existence of higher quality layers.

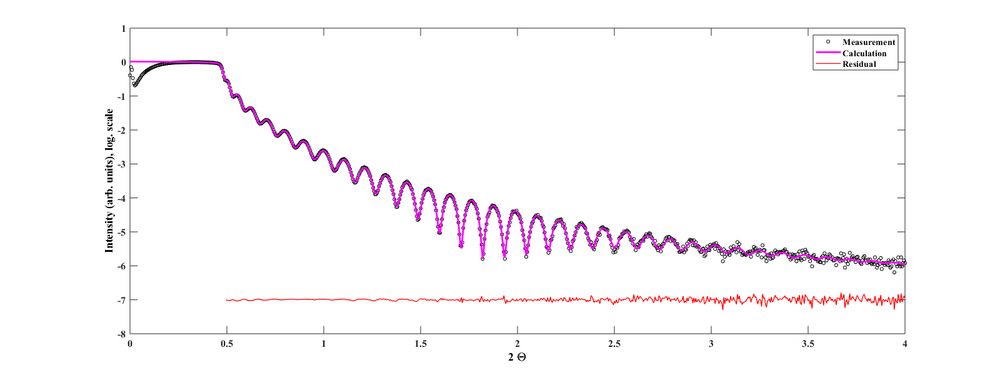
- XRR measurements and modelling.

Deposition rate of Al is 2 Å/s. Substrate: Silicon 4" wafer with native oxide.

Deposition rate of Al is 4 Å/s. Substrate: Silicon 4" wafer with native oxide.
Deposition rate of Al is 6 Å/s. Substrate: Silicon 4" wafer with native oxide.

Deposition rate of Al is 8 Å/s. Substrate: Silicon 4" wafer with native oxide.
Deposition rate of Al is 10 Å/s. Substrate: Silicon 4" wafer with native oxide.


| XRR results | ||||||||||||||||||||||||||||||||||||||||||||||||||||||||||||||||||||||||||||||||||||||||||||
|
| ||||||||||||||||||||||||||||||||||||||||||||||||||||||||||||||||||||||||||||||||||||||||||||

Sheet resistance
| Four point probe measurements | |||||||||||||
|
SEM results
The film surface morphology has been observed by SEM. Magnification is identical on all images (150 kX). It seems that the density of grain boundaries becomes less and the individual grains becomes larger as the deposition rate increases. Nevertheless, since the SEM alone cannot unambiguously claim that statement, it need to be verified by X-ray diffraction grain analysis.
- SEM results.
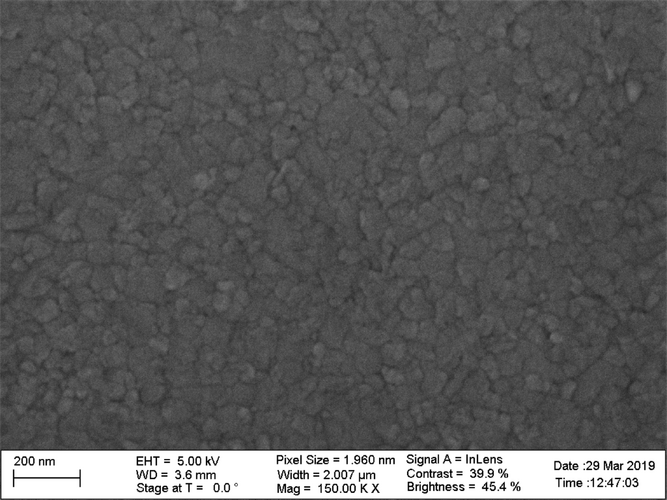
Deposition rate of Al is 2 Å/s. Substrate: Silicon 4" wafer with native oxide.

Deposition rate of Al is 4 Å/s. Substrate: Silicon 4" wafer with native oxide.

Deposition rate of Al is 6 Å/s. Substrate: Silicon 4" wafer with native oxide.

Deposition rate of Al is 8 Å/s. Substrate: Silicon 4" wafer with native oxide.

Deposition rate of Al is 10 Å/s. Substrate: Silicon 4" wafer with native oxide.


