Specific Process Knowledge/Back-end processing/Polymer Injection Molder/Process
Process overview
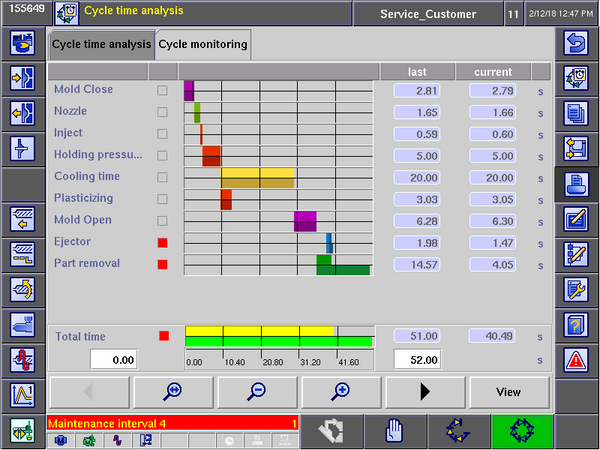
Once a process is running satisfactory, the machine also has tools that can be used for monitoring a running process. These tools can help to ensure desired sample quality and reproducibility. Press the second button from the top on the right column of buttons to get to the 'Cycle time analysis' screen:
- 'Mold Close' to 'Part removal': In the left part of the screen the individual phases of the injection molding cycle is listed. Just to the right of these names there's a small box. If it's gray it means this step i currently not active. If it's red it means this step is currently active (so in this example the sample is currently being ejected by the ejector pins and the part (sample) is removed by the robot).
- Progress bars: A little further to the right (in the center of the screen), progress bars will indicate position and timing of each individual step in the cycle (both last cycle and current cycle). Note that the 'Part removal' step of Variotherm processes often takes quite a long time. This is because the 'Mold pause time' delay (mentioned in section '9. Ejection') used for reheating the mold is included in this step.
- Last and Current columns: In these columns it's possible to see how long time each phase takes in the currently active cycle. For comparison the corresponding time during the last cycle is also shown.
- Total time: In the bottom of the screen a progress bar will indicate progress for the currently running (yellow) and previous cycles (green). Please note that the time axis of the progress bars do not autoscale. Min and max time scale values must be entered manually (but since the total cycle time for both the current and last cycle is shown right above, it's very easy to enter a sensible value).
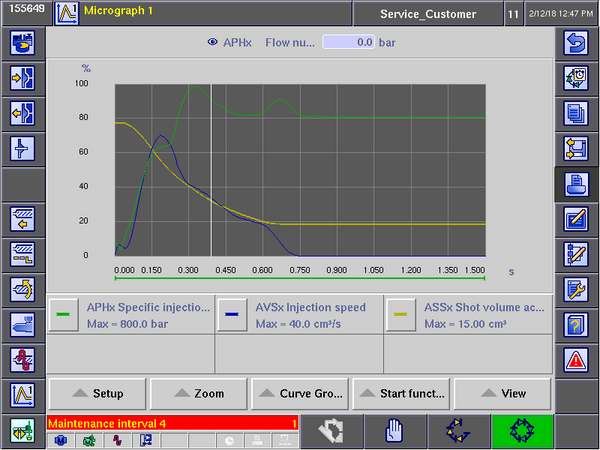
The injection molding machine also has tools for monitoring process parameters during the injection molding cycle. Usually the most interesting events happen around injection, so data logging is often centered around this event. But there are many and almost endless possibilities. To ensure reproducible results it can be beneficial to monitor parameters that are tightly linked to sample quality/properties which include injection speed and injection pressure. Pressing the second to last button on the left side of the screen will take you to the 'Micrograph' tool:
- Setup: To get started you can press 'Setup' and then 'Manual setup' and select relevant parameters. On the tab 'Measurement duration' a start condition (in this example 'Start injection' was chosen) and a measurement duration (in this example 1,5 sec) can be selected. On the tab 'Curve selection' parameters to be plotted are selected (in this example specific injection pressure, injection speed and shot volume were selected, but there are many other possibilities). Since all selected process parameters are plotted on the same y-axis, this axis will always show the unit per cent and always be scaled 0-100%. The 100% value is then set independently for each plot (in this case 800 bar, 40,0 cm3 and 15,0 cm3 was selected for the 100% value of specific injection pressure, injection speed and shot volume respectively.
- Other settings: There are many other possibilities for setting up monitoring features, logging process parameters to file, monitor sample quality and e.g. discard samples that do not meet set requirements. Consult the original machine manual or ask for details.

