Specific Process Knowledge/Characterization/Profiler/Apex software: Difference between revisions
| (20 intermediate revisions by the same user not shown) | |||
| Line 5: | Line 5: | ||
''All text by '''reet, DTU Nanolab''''' | |||
=Apex software for data analysis= | |||
The Tencor-KLA P17 stylus profiler comes with advanced data analysis software called APEX. We have an extra license for the software on a computer in the basement of building 346. The computer is located at the back of room 904 between the XRD Powder and the AFM. At the moment remote access is not possible, but you are able to access your files on the M-drive from the computer. Let us know if you would like us to find a solution for remote access and/or would like us to move the analysis computer to a room with daylight, as we are not sure how many of you would actually like to use the software. | |||
To use Apex, your data must be in a format that Apex can open. For line profiles that means you have to open the data in the Profiler Software first, which can only be done on the P17 computer in the cleanroom. With the data open or selected, press the Apex button and save it in Apex in a native format. It is also possible to check a box in the scan recipe that makes it possible to open the data in Apex automatically (see the Profiler Help document for more details or ask staff). Finally some data formats (e.g., 3D maps and 3D stress data) can always be opened in Apex. | |||
For | |||
==How to use the software == | ==How to use the software == | ||
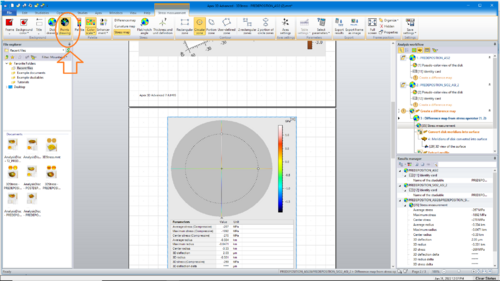
[[image:pick-points-drawing.png|500x500px|right|thumb|How to choose to show only the measured line scans rather than the interpolated surface that APEX likes to calculate (see orange arrow). Screenshot by reet, DTU Nanolab, from Apex.]] | |||
There are a number of tutorials and a thorough help document which you will find when you open the program. There is also a small introduction as an appendix to the [https://labmanager.dtu.dk/view_binary.php?fileId=4699 P17 help document] ''(requires login)''. | |||
Apex offers many formats for saving the data in nice reports and various options for exporting data. | |||
If | If Apex has automatically generated a surface from your line profiles of data, it is possible to view the underlying profiles by right-clicking on the surface and choosing Points Drawing instead of Lines Drawing or finding the same option (Points drawing) in the top ribbon. See figure on the right. | ||
Best of luck and please contact [mailto: | Best of luck and please contact [mailto:characterization@nanolab.dtu.dk characterization@nanolab.dtu.dk] if you have any questions or helpful tips. | ||
Latest revision as of 12:00, 24 May 2023
Feedback to this page: click here
All text by reet, DTU Nanolab
Apex software for data analysis
The Tencor-KLA P17 stylus profiler comes with advanced data analysis software called APEX. We have an extra license for the software on a computer in the basement of building 346. The computer is located at the back of room 904 between the XRD Powder and the AFM. At the moment remote access is not possible, but you are able to access your files on the M-drive from the computer. Let us know if you would like us to find a solution for remote access and/or would like us to move the analysis computer to a room with daylight, as we are not sure how many of you would actually like to use the software.
To use Apex, your data must be in a format that Apex can open. For line profiles that means you have to open the data in the Profiler Software first, which can only be done on the P17 computer in the cleanroom. With the data open or selected, press the Apex button and save it in Apex in a native format. It is also possible to check a box in the scan recipe that makes it possible to open the data in Apex automatically (see the Profiler Help document for more details or ask staff). Finally some data formats (e.g., 3D maps and 3D stress data) can always be opened in Apex.
How to use the software

There are a number of tutorials and a thorough help document which you will find when you open the program. There is also a small introduction as an appendix to the P17 help document (requires login).
Apex offers many formats for saving the data in nice reports and various options for exporting data.
If Apex has automatically generated a surface from your line profiles of data, it is possible to view the underlying profiles by right-clicking on the surface and choosing Points Drawing instead of Lines Drawing or finding the same option (Points drawing) in the top ribbon. See figure on the right.
Best of luck and please contact characterization@nanolab.dtu.dk if you have any questions or helpful tips.
