Specific Process Knowledge/Thin film deposition/Deposition of Titanium Nitride/Deposition of Titanium Nitride using Lesker sputter tool
Reactive sputtering of TiN
This page presents the results of TiN deposition using reactive sputtering. The source is Ti, and the reactive gas is N2.
These depositions were carried out with the Sputter-System(Lesker). It is also possible to deposit TiN with the Sputter-System Metal-Oxide (PC1) and Sputter-System Metal-Nitride (PC3), which was installed in the cleanroom in 2020 in part exactly to enable deposition of high-quality nitrides like TiN. Ask Nanolab staff for further information.
The fabrication and characterization described below were conducted in 2019 by Evgeniy Shkondin, DTU Nanolab. The prepared samples were investigated by X-ray Photoelectron Spectroscopy (XPS) and Spectroscopic Ellipsometry. Several parameters influences the quality of the films. The analysis included variations of power, pressure, substrate temperature and N2/Ar ratio.
In short, the key to prepare high quality, stochiometric, conducting TiN layers is to apply the following deposition parameters:
- Before TiN deposition on the working wafer, always do pre-sputtering of Ti without N2 for around 2-3 min with the same power and pressure as desired for TiN.
This will clean the target and decrease the level of moisture in the chamber.
- High power in the range 220W-250W
Lesker sputter tool uses 2-inch targets. For Ti source, the highest allowed power is 250W. Deposition rate increases by using high power and it lowers the incorporation of oxygen in the film.
- Low pressure (1-2 mTorr)
Lowering the pressure improves stochiometry and lowers the oxygen content.
- High substrate temperature (400°C)
Generally, the substrate temperature affects the density.
- Work with N2 concentration in the range 20-50%
The higher the nitrogen concentration the lower the deposition rate, and it will lead to problems with respect to oxygen contamination.
The investigation is based on two powers - 110W and 220W in the pressure range between 1 to 14 mTorr. The substrate temperature was kept at 400°C with N2/Ar ratio 20/80%.
Spectroscopic Ellipsometry
The spectroscopic ellipsometry measurements were conducted by using VASE Ellipsometer. The purpose of the investigation is to see how the change in deposition power and pressure affects the shape of the dielectric function. Other parameters - such as layer thickness were also extracted.
Drude-Lorentz model
Drude-Lorentz is commonly used to fit TiN complex dielectric function.
where:
is a high-frequency dielectric constant.


The Drude term can be written as follow:
where:
- dielectric permittivity of vacuum,
- Planck constant,
- resistivity,
- scattering time.


Lorentz oscillator term is given by:
where:
- number of oscillator,
- Amplitude,
- Broadening of each oscillator,
- Center energy of the Lorentz oscillator.


Dielectric function analysis
| High Power. Deposition time: 20min. Substrate temperature - 400°C | Drude term | Lorentz oscillator - 1 | Lorentz oscillator - 2 | Lorentz oscillator - 3 | ||||||||||
|---|---|---|---|---|---|---|---|---|---|---|---|---|---|---|
| Power (W) | Pressure (mTorr) | Thickness (nm) | (Ohm cm) | (fs) | (eV) | (eV) | (eV) | (eV) | (eV) | (eV) | ||||
| 220 | 1 | 87.01 | 3.489 | 7.5618·10-5 | 1.008 | 192.557054 | 0.0213 | 6.321 | 9.689831 | 2.7132 | 5.604 | - | - | - |
| 220 | 2 | 66.13 | 2.609 | 2.017·10-4 | 1.141 | 2.083940 | 0.8848 | 3.492 | 8.125820 | 3.2412 | 5.944 | 15.781023 | 0.9923 | 1.053 |
| 220 | 4 | 66.40 | 1.934 | 6.6567·10-4 | 1.041 | 2.439534 | 1.3777 | 3.724 | 4.677488 | 4.0837 | 6.160 | 12.110575 | 0.9458 | 0.959 |
| 220 | 6 | 75.11 | 1.347 | 2.587·10-3 | 0.655 | 2.303432 | 1.7123 | 3.942 | 1.934678 | 5.4051 | 6.420 | 7.712139 | 0.9659 | 0.883 |
| 220 | 8 | 81.94 | 1.271 | 4.273·10-3 | 0.242 | 2.038004 | 1.7074 | 4.062 | 1.614453 | 5.6564 | 6.677 | 5.212949 | 0.8602 | 0.895 |
| 220 | 10 | 82.59 | 1.138 | 5.257·10-3 | 0.323 | 1.672949 | 1.6265 | 4.186 | 1.433617 | 7.9416 | 7.058 | 4.294563 | 0.8546 | 0.902 |
| 220 | 12 | 82.40 | 1.090 | 5.807·10-3 | 0.443 | 1.450316 | 1.5414 | 4.262 | 1.368362 | 9.1405 | 7.128 | 3.787770 | 0.8471 | 0.906 |
| 220 | 14 | 81.88 | 1.089 | 5.838·10-3 | 0.468 | 1.415215 | 1.5370 | 4.266 | 1.349390 | 9.2650 | 7.074 | 3.579245 | 0.8420 | 0.909 |
| Low Power. Deposition time: 40min. Substrate temperature - 400°C | Drude term | Lorentz oscillator - 1 | Lorentz oscillator - 2 | Lorentz oscillator - 3 | ||||||||||
| Power (W) | Pressure (mTorr) | Thickness (nm) | (Ohm cm) | (fs) | (eV) | (eV) | (eV) | (eV) | (eV) | (eV) | ||||
| 110 | 2 | 37.28 | 1.951 | 3.4619·10-4 | 0.719 | 2.294032 | 2.7712 | 4.298 | 8.807626 | 4.6007 | 7.311 | 14.494131 | 1.0222 | 1.025 |
| 110 | 4 | 32.42 | 2.024 | 9.724·10-4 | 0.890 | 5.185267 | 3.5747 | 4.958 | 7.900142 | 2.2325 | 7.115 | 12.284271 | 0.8444 | 1.012 |
| 110 | 6 | 34.12 | 1.907 | 2.109·10-3 | 1.119 | 3.946173 | 3.4395 | 4.953 | 4.368733 | 1.9486 | 7.189 | 7.063107 | 0.8046 | 0.983 |
| 110 | 8 | 35.58 | 1.694 | 2.661·10-3 | 1.292 | 2.990718 | 3.3861 | 4.928 | 3.091825 | 2.0160 | 7.163 | 4.843337 | 0.7813 | 0.980 |
| 110 | 10 | 37.02 | 1.526 | 2.741·10-3 | 1.592 | 2.521075 | 3.5788 | 4.959 | 2.664635 | 2.1239 | 7.295 | 3.751751 | 0.7497 | 0.975 |


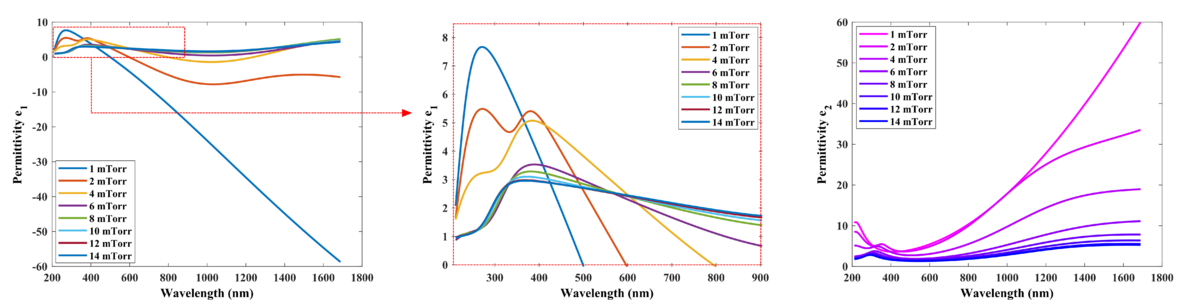
Dielectric function can be rearranged in order to separate real and complex parts: . Here, is a real part of the permittivity, and is imaginary part describing optical losses.


Process power and pressure is extremely important values since the slightest deviation will change the TiN optical performance. The clear metallic behavior is observed at lowest pressure and the highest power. Decreasing the power and/or increasing the process pressure will change the metallic state into oxynitride and oxide phase response.
DC power 220W
At this power, the metallic response (negative values of ) can be observed in the pressure range below 3mTorr, although only 1 and 2 mTorr can be used in plasmonic applications. A small variation in thickness should not severely affect the shape of permittivity function.
- DC Power 220W

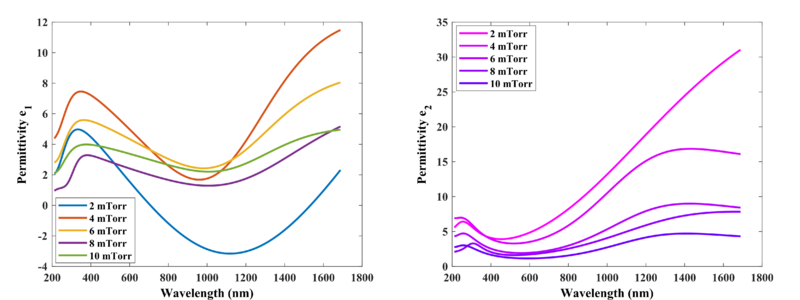
DC power 110W
At low power, the metallic response (negative values of ) can be observed in the pressure range below 2mTorr, although it never become strongly negative. The deposition rate is 4 times lower compared to 220W, which unavoidably leads to oxygen incorporation in the film. A small variation in thickness should not severely affect the shape of permittivity function.
- DC Power 110W

XPS analysis
XPS measurements of all samples has been performed using XPS K-Alpha equipment. The purpose of the investigation is to see how the change in deposition power and pressure affects the stochiometry and elemental peak shape.
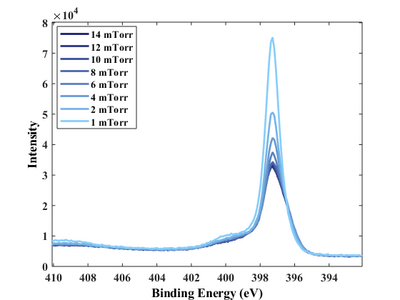
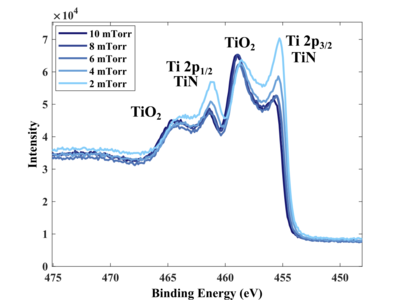
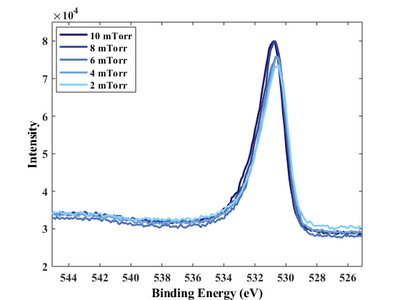
High resolution scans of individual elements
The prepared TiN films were Ar+ sputtered-cleaned prior to measurements. The Ti 2p scans are the most informative. They clearly show that the lower the process pressure the more present Ti-N bounding in the deposited film. This tendency presents most clearly in the highest chosen power 220W. The conclusion support the result form the ellipsometry measurements - the metallic TiN films grows at low pressure and high power.
DC power 220W
- DC Power 220W
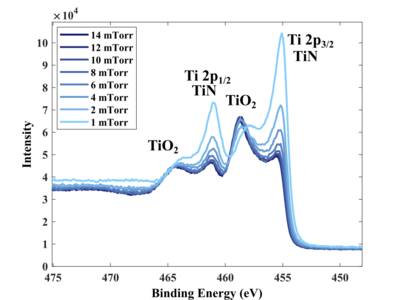
Ti 2p scan.
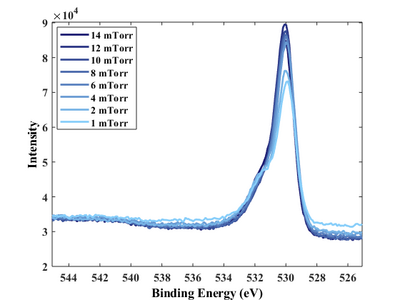
O 1s scan.
N 1s scan.


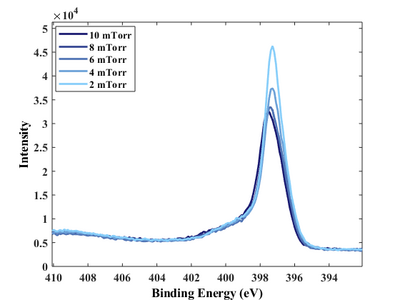
DC power 110W
- DC Power 110W
Ti 2p scan.
O 1s scan.
N 1s scan.


Stochiometry and N2/Ti ratio
XPS Avantage software package has been used to extract information about chemical composition and presence of the deposited TiN films. the presence of C is not properly understood. This is not an air-born adventitious carbon, since the deposited films, were Ar+ sputtered-cleaned. The contamination could come from the Ti target source, incorporation of C from the air into the film structure or background chamber contamination.
| Power (W) | Pressure (mTorr) | Ti (At. %) | N (At. %) | O (At. %) | C (At. %) |
|---|---|---|---|---|---|
| 220 | 14 | 35.20 | 27.26 | 33.34 | 4.20 |
| 220 | 12 | 35.93 | 27.71 | 34.00 | 2.36 |
| 220 | 10 | 36.02 | 27.68 | 33.34 | 2.96 |
| 220 | 8 | 36.23 | 27.74 | 32.93 | 3.10 |
| 220 | 6 | 35.74 | 28.49 | 32.08 | 3.69 |
| 220 | 4 | 36.19 | 29.78 | 30.05 | 3.98 |
| 220 | 2 | 37.12 | 32.33 | 26.08 | 4.47 |
| 220 | 1 | 42.51 | 39.27 | 16.75 | 1.48 |
| 110 | 10 | 35.31 | 26.76 | 33.84 | 4.08 |
| 110 | 8 | 35.86 | 27.01 | 32.91 | 4.22 |
| 110 | 6 | 35.64 | 27.24 | 32.03 | 5.09 |
| 110 | 4 | 34.74 | 27.35 | 30.34 | 7.56 |
| 110 | 2 | 37.18 | 30.26 | 27.08 | 5.48 |
Ideally, the N2/Ti ratio should be equal to 1. However, the presence of oxynitride/oxide phase lowers this value. In general, the stochiometry improves by raising the power and lowering the process pressure.
- Stochiometry
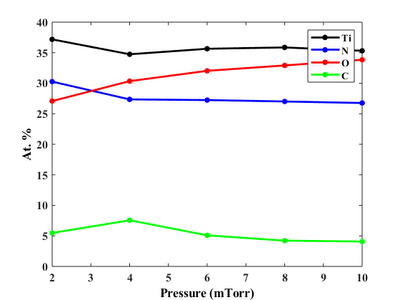
Elemental presence as a function of process pressure (110W).
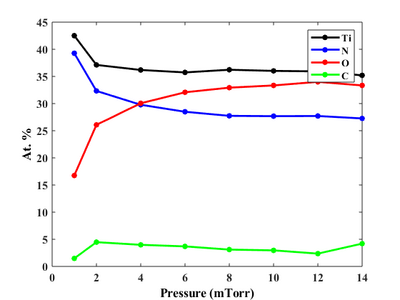
Elemental presence as a function of process pressure (220W).
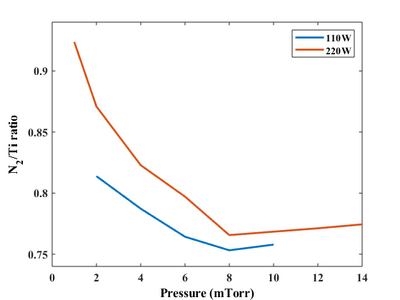
N2/Ti ratio for 220W and 110W deposition power.


Effect of substrate temperature
Preparation of high-quality metallic TiN thin films require high substrate temperature. This method excludes the possibility to deposit TiN on temperature sensitive materials - like photoresist. Normally, the substrate temperature affects the density of the deposited film. Only room temperatur vs. 400oC has been analyzed here. The conclusion is clear - high temperature is the key to get the good plasmonic films.
| High Power. Deposition time: 10min | Drude term | Lorentz oscillator - 1 | Lorentz oscillator - 2 | Lorentz oscillator - 3 | |||||||||||
|---|---|---|---|---|---|---|---|---|---|---|---|---|---|---|---|
| Temperature (oC) | Power (W) | Pressure (mTorr) | Thickness (nm) | (Ohm cm) | (fs) | (eV) | (eV) | (eV) | (eV) | (eV) | (eV) | ||||
20 |
220 | 2 | 41.06 | 2.574 | 6.5701·10-4 | 0.815 | 5.851313 | 6.8806 | 6.711 | 14.513401 | 1.0293 | 1.038 | - | - | - |
400 |
220 | 2 | 46.09 | 2.692 | 2.1618·10-4 | 0.697 | 1.087128 | 1.3685 | 3.824 | 8.301574 | 3.5998 | 6.291 | 10.301534 | 1.0371 | 1.104 |
- Effect of substrate temperature. Deposition time 10 min. Power 220W. Pressure 2 mTorr
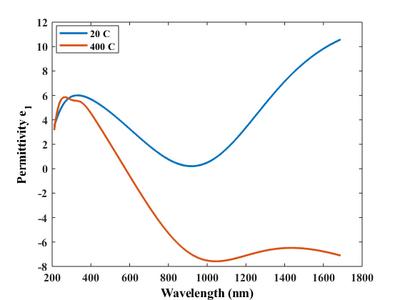
Real part of permittivity (10 min, 220W, 2 mTorr).
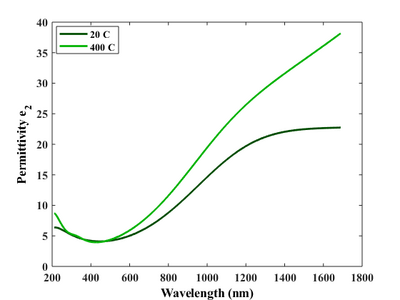
Imaginary part of permittivity (10 min, 220W, 2 mTorr).


Effect of N2/Ar ratio
N2/Ar ratio is less explored but doesn't seem to be very critical. The increase of N2 leads to a decrease in deposition rate since less Ar available to do the source sputtering. The presence of background moisture will affect the quality of thin film if the deposition rate is too low.
Here, N2 flow of 20% and N2 flow of 80% were compared.
From the ellipsometry point of view, both show very good metallic performance, although they are difficult to compare due to very different thicknesses of layers (20 min deposition time for both films).
XPS results reveal almost identical Ti 2p scans.
Al-in-all the N2 flow in the range between 20-50% should be sufficient for TiN film deposition.
| High Power. Deposition time: 20min | Drude term | Lorentz oscillator - 1 | Lorentz oscillator - 2 | Lorentz oscillator - 3 | |||||||||||
|---|---|---|---|---|---|---|---|---|---|---|---|---|---|---|---|
| N2 (flow (%)) | Power (W) | Pressure (mTorr) | Thickness (nm) | (Ohm cm) | (fs) | (eV) | (eV) | (eV) | (eV) | (eV) | (eV) | ||||
20 |
220 | 1 | 87.01 | 3.489 | 7.5618·10-5 | 1.008 | 192.557054 | 0.0213 | 6.321 | 9.689831 | 2.7132 | 5.604 | - | - | - |
80 |
220 | 1 | 39.88 | 1.926 | 1.6566·10-4 | 0.761 | 7.288805 | 4.9948 | 6.061 | 48.12146 | 0.5020 | 0.442 | - | - | - |
- Effect of substrate temperature. Deposition time 20 min. Power 220W. Pressure 2 mTorr
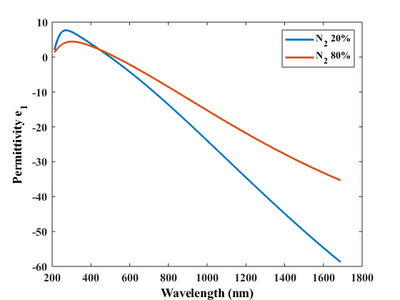
Real part of permittivity (220W, 2 mTorr).
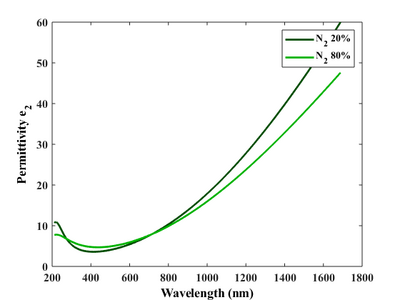
Imaginary part of permittivity (220W, 2 mTorr).
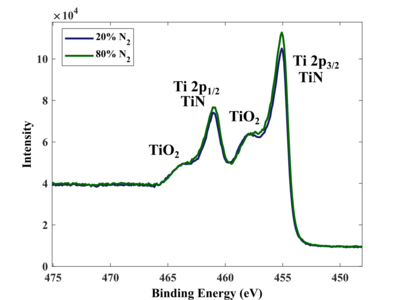
Ti 2p scan.


