Specific Process Knowledge/Thin film deposition/ALD2 (PEALD)/HfO2 deposition using ALD2
The content on this page, including all images and pictures, was created by DTU Nanolab staff, unless otherwise stated.
Feedback to this page: click here
HfO2 can be deposit by ALD using both thermal and plasma methods. The typical deposition temperature lies within 150-350 °C, although using plasma the temperature can be lowered down to 100 °C without significant sacrifice of uniformity. It is worth mention that a unique feature of Picosun R-200 Advanced Plasma ALD tool, so-called - Picoflow Diffusion Enhancer, is used in the plasma process.
HfO2 deposition using TEMAHf and H2O precursors
(Results from the acceptance test)
The test was done with 400 cycles at 250 °C where the growth rate was measured to be 0.0804 nm/cycle.
| TEMAHf | H2O | |
|---|---|---|
| Nitrogen flow | 200 sccm | 150 sccm |
| Pulse time | 1.5 s | 0.1 s |
| Purge time | 6.0 s | 6.0 s |
Ellipsometry measurement

Uniformity profile across 150 mm Si wafer based on 49 measurement points measured with ellipsometer. The values for the grown oxide thickness can be seen in the table below.
| Average thicknes (nm) | Minimum thickness (nm) | Maximum thickness (nm) | Standard deviation | Procent deviation (%) |
| 32.16 | 31.28 | 33.29 | 0.49 | 6.2486 |
AFM measurement

The AFM measured roughness was 2.09nm. The high roughness value occurred due to formation of clustered Hf2 which are also visible in the SEM as shown in the figure below.
SEM measurement

Pernille Voss Larsen, Mikkel Dysseholm Mar and Tanja Amport, DTU Nanolab (former DTU Danchip), 2016-2017.
HfO2 deposition on trenches using TEMAHf and H2O precursors
(Results from the acceptance test)
The test was done with 400 cycles at 250 °C where the growth rate was measured to be between 0.954-1.22 nm/cycle depending on the depth.
| TEMAHf | H2O | |
|---|---|---|
| Nitrogen flow | 200 sccm | 200 sccm |
| Pulse time | 1.5 s | 10 s |
| Purge time | 20.0 s | 20.0 s |
HfO2 deposition using O2 plasma
Recipe name: HfO2 O2 plasma
Temperature window: 100 °C - 350 °C
The deposition rate is measure to be 0.106 nm/cycle and 0.119 nm/cycle for 300 °C and 100 °C respectively.
| TEMAHf | O2 | |
|---|---|---|
| Nitrogen flow | 200 sccm | 150 sccm |
| Pulse time | 0.5 s | 30 s |
| Purge time | 10.0 s | 20.0 s |
Note! If deposition time is critical, the reduction of O2 plasma pulse time from 30 s to 10 s (and corresponding "RF power on" from 28 to 8 s) do not significantly impact the uniformity, also the purge step after O2 pulse can be reduced down to 10s.
| Plasma source settings | ||||
|---|---|---|---|---|
| RF power (W) | Ar carrier flow (sccm) | Plasma gas flow (sccm) | t1 stabilization (s) | t2 RF Power on (s) |
| 3000 | 150 | 500 | 1.4 | 28 |
Note! Remember to obey the relation: [Pulse time - (t1+t2)] > 0.5 s
| Picoflow diffusion settings | ||||
|---|---|---|---|---|
| Flow (sccm) | v1 (s) | v2 (s) | v3 (s) | v4 (s) |
| 40 | 1.5 | 1.3 | 1.5 | 0.5 |
PicoflowTM Diffusion Enhancer
PicoflowTM Diffusion Enhancer is optional feature and provides stop flow functionality for lengthening the time available for precursor diffusion and surface reactions on substrates without risk of back-diffusion into source lines of the reaction chamber. The RECIPE "Picoflow" page depicts programmable parameters used for controllingthe stop flow functionalities.
- The picoflow recipe page of the user interface.
-
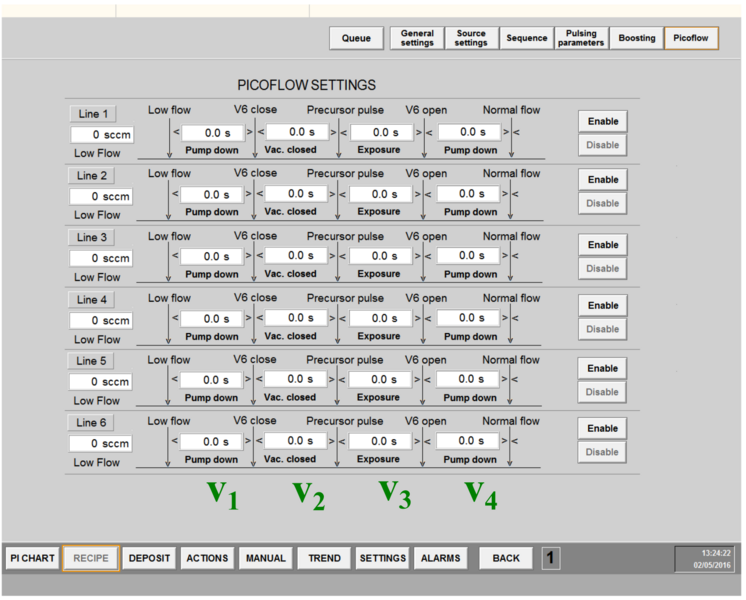

To enable or disable the stop flow functionality, set the control for V6 valve to Enable/Disable.
For each source line, the selection Enable/Disable controls stop flow usage for the selected source lines.
Source Flow box marked with "sccm" sets the mass flow rate used in the source line at low flow state. The typical value is 40 sccm.
Note. Set the same source flow for every line, even if the source line is disabled for the low flow state.
- v1. The value in the box between Low Flow and V6 close sets the time from Low flow start to V6 close. The purpose of this delay is to ensure the pressure drop of the reaction chamber before the V6 valve close. Typical value is 1.5 s.
- v2. The value in the box between V6 close and Precursor pulse sets the time from V6 close to Precursor pulse. The purpose of this delay is to ensure the V6 valve close before precursor pulse activation. Typical value is 1.3 s
- v3. The value in the box between Precursor pulse and V6 open defines how long the mass flow rates of nitrogen gas through the source lines are kept at low value.
- v4. The value in the box between V6 open and Normal flow defines how long low flow rate is kept low after opening of V6. Typical value is between 0.0 s and 1.0 s.
Note: The pulse + purge time for the enabled stop flow source line must be longer than the combined stop flow delays set in the stop flow page. For example, if the pulse + purge time is 1.0s + 6.0s = 7.0, then the sum of the four delay times must be less than 7.0s.
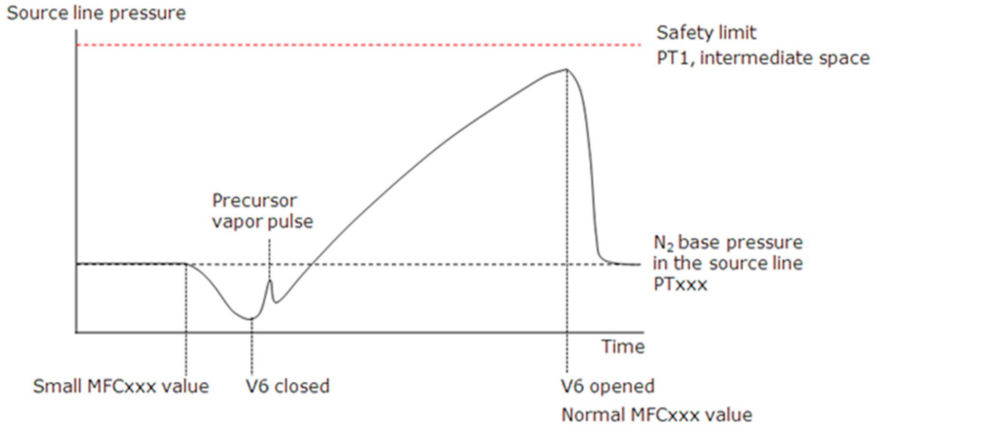
- The typical source line pressure curve with Picoflow.
-

Ellipsometry measurement
The spectroscopic ellipsometry measurements were conducted by using VASE Ellipsometer. The purpose of the investigation is to evaluate refractive index as well as to analyse the uniformity.
Refractive index
-
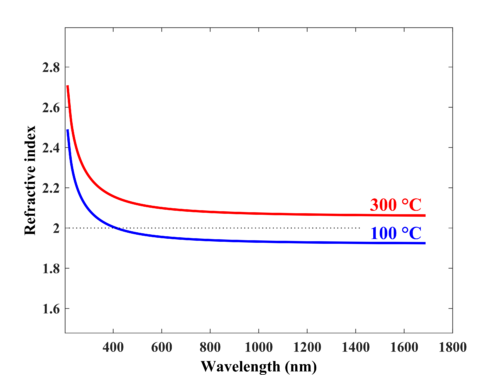 Refractive index of approx. 100 nm HfO2 prepared by 100°C and 300°C for comparison

Thickness distribution and uniformity
-
 Thickness distribution across the 150 mm wafer (100C 1000cycles)
 -
 Thickness distribution across the 150 mm wafer (300C 1000cycles)


| Ellipsometry results for 100°C 1000 cycles of HfO2 | ||||
|---|---|---|---|---|
| Average thicknes (nm) | Minimum thickness (nm) | Maximum thickness (nm) | Standard deviation | Procent deviation (%) |
| 118.86 | 113.92 | 124.07 | 3.36 | 4.2721 |
| Ellipsometry results for 300°C 1000 cycles of HfO2 | ||||
|---|---|---|---|---|
| Average thicknes (nm) | Minimum thickness (nm) | Maximum thickness (nm) | Standard deviation | Procent deviation (%) |
| 109.60 | 104.77 | 112.48 | 2.37 | 3.51 |
Evgeniy Shkondin, DTU Nanolab, 2020.