Specific Process Knowledge/Thin film deposition/ALD2 (PEALD)/AlN deposition using ALD2
Feedback to this page: click here
General Information
The AlN process should never run above 350 °C due to the decomposition of the trimethylaluminium. As already mentioned in the general ALD2 (PEALD) page oxides and nitrides cannot be deposited at the same time. Since the aluminium nitride requires the plasma source, we run all plasma processes without the thermal lid. The substrate temperature is around 50 °C lower than the setpoint, because the chamber volume becomes bigger without the thermal lid.
Results from the acceptance test
During the acceptance test, AlN was deposited using TMA and N2 plasma. We have modified and improved recipes since.
Deposition of AlN using TMA and NH3 plasma
Recipe name: AlN NH3 plasma
Temperature window: 250 °C - 350 °C
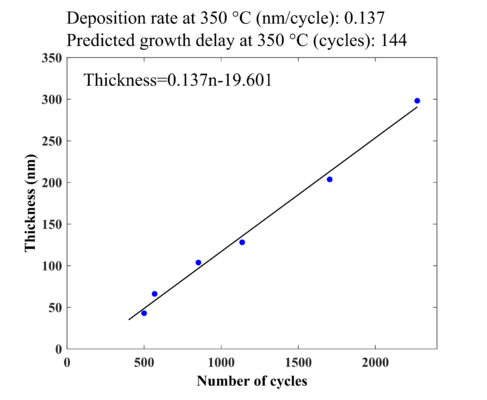
The deposition rate is measure to be 0.137 nm/cycle for 350 °C with growth delay of 144 cycles.
| TMA | NH3 | |
|---|---|---|
| Nitrogen flow | 100 sccm | 150 sccm |
| Pulse time | 0.1 s | 5 s |
| Purge time | 8 s | 30 s |
| Plasma source settings | ||||
|---|---|---|---|---|
| RF power (W) | Ar carrier flow (sccm) | Plasma gas flow (sccm) | t1 stabilization (s) | t2 RF Power on (s) |
| 3000 | 150 | 100 | 1 | 3.4 |
Note! Remember to obey the relation: [Pulse time - (t1+t2)] > 0.5 s
-
Deposition function for AlN with NH3 plasma (350 °C)
Spectroscopic ellipsometry
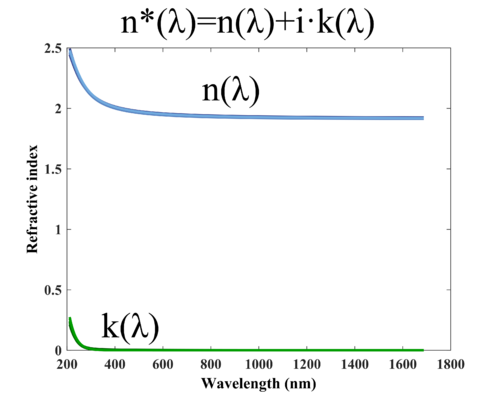
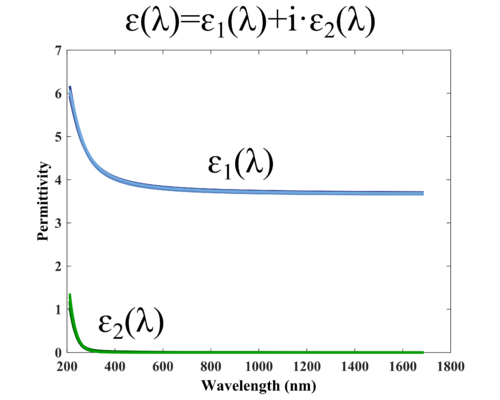
The spectroscopic ellipsometry measurements were conducted by using VASE Ellipsometer. The purpose of the investigation is to evaluate refractive index and dielectric function as well as to analyse the growth rate and uniformity.
Refractive index and permittivity
-
Refractive index and absorption koefficient as a function of wavelength.
-
Real and imaginary permittivity as a function of wavelength.
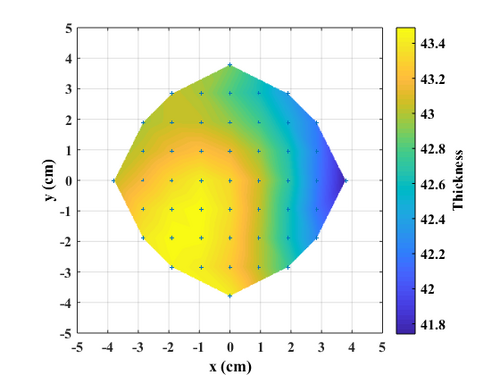
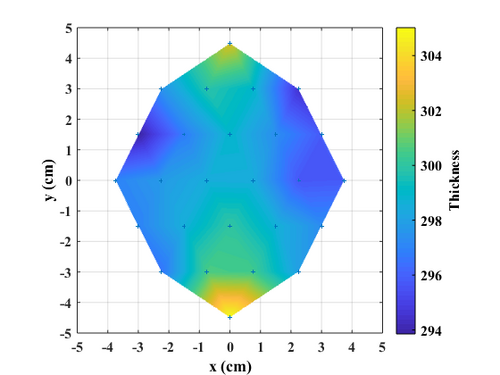
Thickness distribution and uniformity
-
Thickness distribution across the 100 mm wafer (350C 500cycles)
-
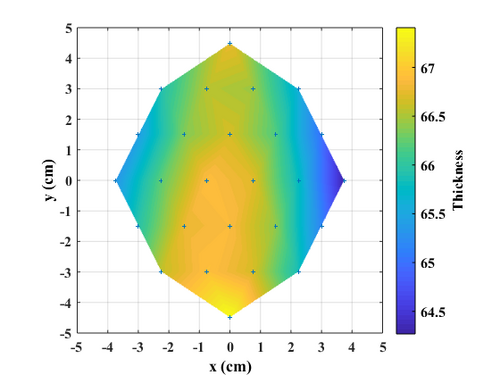
Thickness distribution across the 100 mm wafer (350C 568cycles)
-
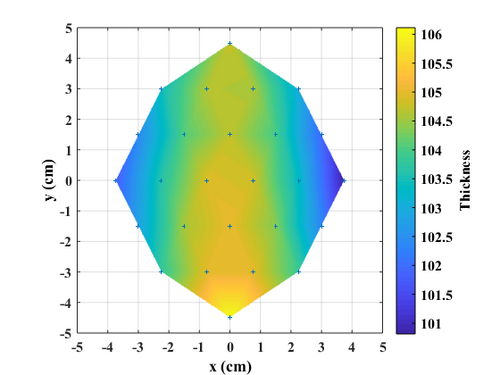
Thickness distribution across the 100 mm wafer (350C 852cycles)
-
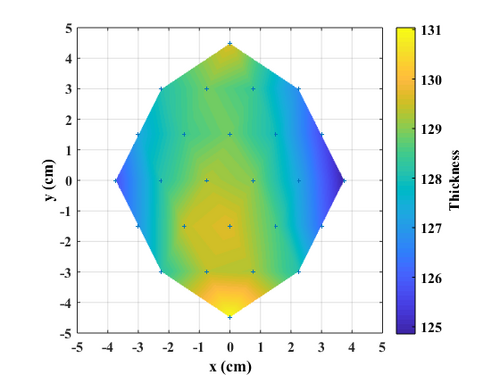
Thickness distribution across the 100 mm wafer (350C 1136cycles)
-
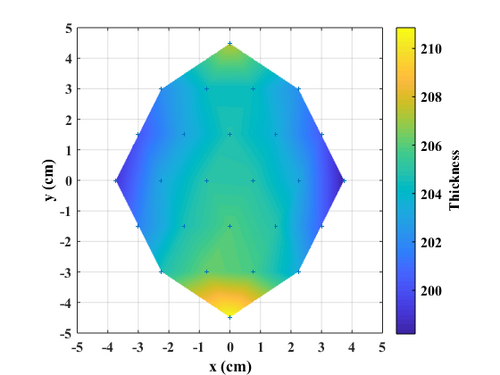
Thickness distribution across the 100 mm wafer (350C 1704cycles)
-
Thickness distribution across the 100 mm wafer (350C 2272cycles)
| Ellipsometry results for AlN deposited with TMA and NH3 plasma | ||||||
|---|---|---|---|---|---|---|
| Number of cycles | Temperature (°C) | Average thicknes (nm) | Minimum thickness (nm) | Maximum thickness (nm) | Standard deviation | Procent deviation (%) |
| 500 | 350 | 42.9565 | 41.7422 | 43.4888 | 0.42652 | 2.0331 |
| 568 | 350 | 66.1824 | 64.2685 | 67.4074 | 0.7256 | 2.3714 |
| 852 | 350 | 103.8306 | 100.8147 | 106.1143 | 1.2407 | 2.552 |
| 1136 | 350 | 128.1302 | 124.8565 | 131.037 | 1.444 | 2.4118 |
| 1704 | 350 | 203.6618 | 198.1933 | 210.8584 | 2.7121 | 3.1094 |
| 2272 | 350 | 298.1225 | 293.8553 | 305.0185 | 2.3923 | 1.8723 |
X-ray photoelectron spectroscopy
XPS measurements of all samples has been performed using XPS K-Alpha equipment. The purpose of the investigation is to get idea about film stoichiometry and possible contamination.
Stoichiometry
| Stoichiometry results for AlN deposited with TMA and NH3 plasma | |||||
|---|---|---|---|---|---|
| Number of cycles | 568 | 852 | 1136 | 1704 | 2272 |
| Average thickness (nm) | 66.18 | 103.83 | 128.13 | 203.66 | 298.12 |
| Al (at.%) | 47.54 | 48.15 | 47.82 | 47.77 | 47.61 |
| N (at.%) | 40.80 | 40.60 | 41.13 | 41.01 | 41.11 |
| O (at.%) | 11.66 | 11.25 | 11.05 | 11.22 | 11.28 |
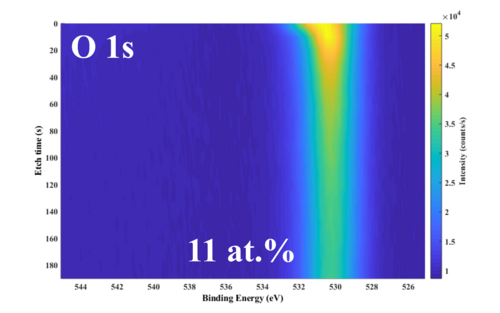
Presence of Oxygen and Carbon
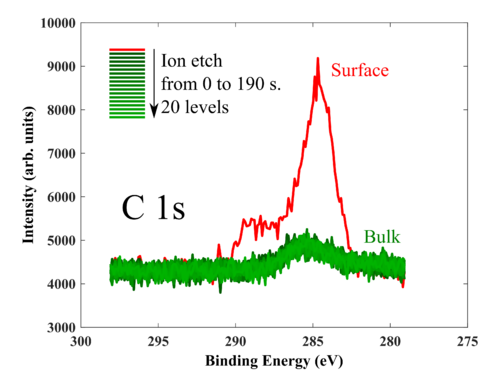
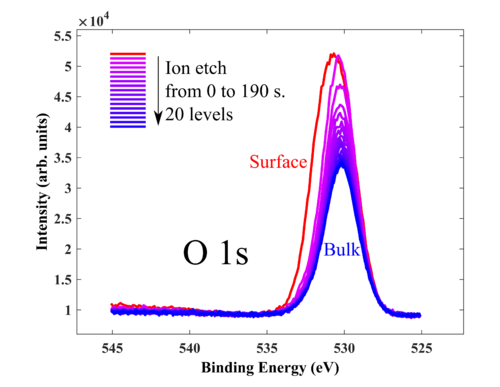
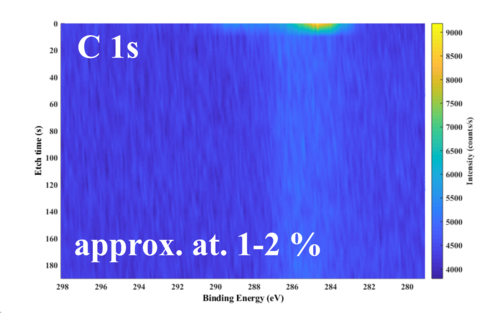
Traces of carbon is found in the deposited films, their origine is not clear, but most likely due to TMA decomposition. Another source is incomplete ALD reaction.
-
C1s signal
-
O1s signal
-
C1s signal
-
O1s signal

