Specific Process Knowledge/Thin film deposition/ALD2 (PEALD)/Al2O3 deposition using ALD2
Results from the acceptance test
Al2O3 deposition using TMA and H2O precursors
The test was done with 500 cycles at 300 °C where the growth rate was measured to be 0.8544 nm/cycle.
| TMA | H2O | |
|---|---|---|
| Nitrogen flow | 150 sccm | 200 sccm |
| Pulse time | 0.1 s | 0.1 s |
| Purge time | 3.0 s | 4.0 s |
-
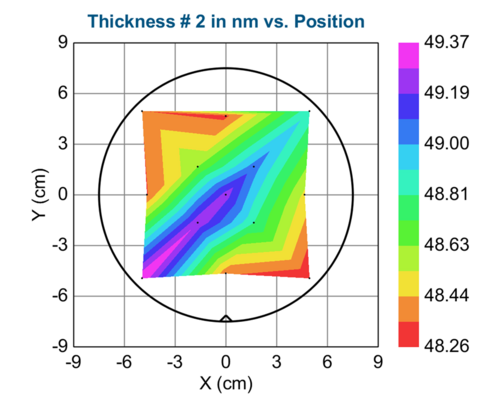
Uniformity profile across 150 mm Si wafer based on 13 measurement points measured with ellipsometer. The uniformity is shown in the figure above and the thickness values can be seen in the table below.
| Parameter | Average | Min. | Max. | Std.Dev | %Range |
|---|---|---|---|---|---|
| Thickness (nm) | 48.72 | 48.26 | 49.37 | 0.40 | 2.2856 |
-
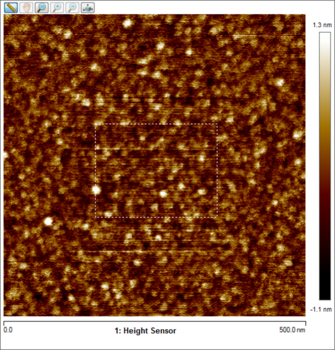
AFM measured roughness 0.240 nm.
Al2O3 with O3
The test was done with 500 cycles at 300 °C where the growth rate was measured to be 0.0752 nm/cycle.
| TMA | H2O | |
|---|---|---|
| Nitrogen flow | 150 sccm | 200 sccm |
| Pulse time | 0.2 s | 0.1 s |
| Purge time | 3.0 s | 4.0 s |
-
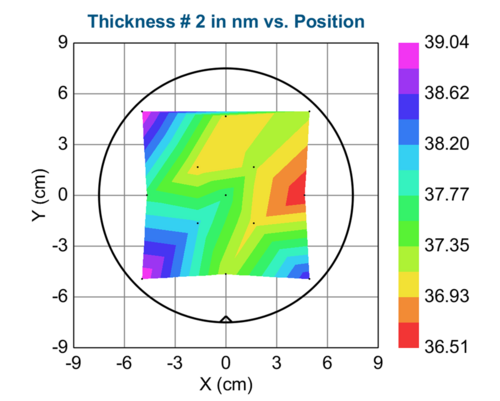
Uniformity profile across 150 mm Si wafer based on 13 measurement points measured with ellipsometer.The uniformity is shown in the figure above and the thickness values can be seen in the table below.
| Parameter | Average | Min. | Max. | Std.Dev | %Range |
|---|---|---|---|---|---|
| Thickness (nm) | 37.63 | 36.51 | 39.04 | 0.81 | 6.7448 |
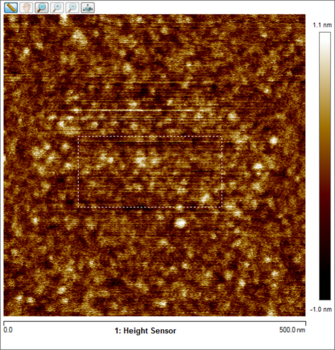
The AFM measured roughness was 0.272 nm.
Other references
Since the ALD2 is very similar to the ALD1 if the thermal lid is installed you might want to get further information, which can be found here.


