Specific Process Knowledge/Thin film deposition/Deposition of Nickel/Stress Wordentec Ni films
Stess in Wordentec deposited Nickel films
Thin films of Ni have tensile stress. It was examined if different deposition rates will give different amounts of stress in Wordentec deposited Ni films and the result is presented here.
Rate dependence
The deposition rate was changed between the depositions. In most cases 200 nm of Ni was deposited (on a blank Si wafer).
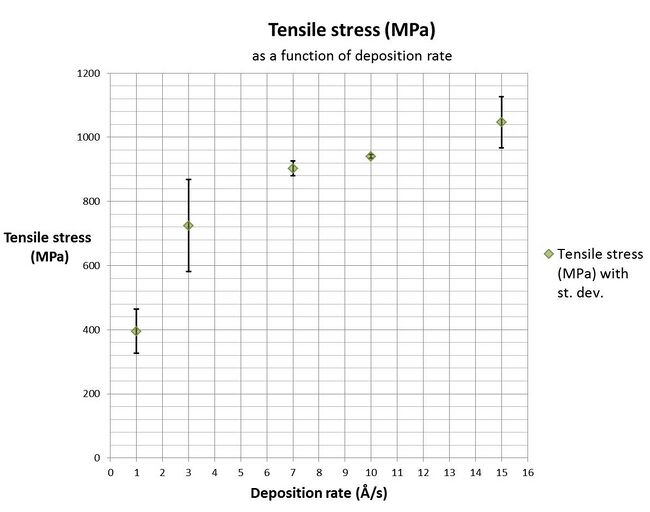
The graph below shows the tensile stress (MPa) in the Ni films for different deposition rates (Å/s). All depositions were made in Wordentec. Stress were measured with Dektak 8 stylus profilometer.
As seen in the graph the tensile stress in the films are decreased for films with lower deposition rate. To obtain a film with lower stress deposition rates of 1 Å/s or 3 Å/s are recommended. However, for films with thicknesses above 100 nm it is recommended not to use as low deposition rate as 1 Å/s while the wafers will be heated up during the very long process time.

| Deposition rate (Å/s) | Stress, average (MPa) | Film thickness (nm) | Comment | |
| Tesile | Compressive | |||
| 15 Å/s* | 1046 MPa | 0 MPa | 200 nm, 200 nm, 200 nm | Average calculated for three films |
| 10 Å/s | 941 MPa | 0 MPa | 200 nm, 200 nm | Average calculated for two films |
| 7 Å/s | 903 MPa | 0 MPa | 200 nm, 200 nm | Average calculated for two films |
| 3 Å/s | 725 MPa | 0 MPa | 110 nm, 200 nm, 200 nm | Average calculated for three films |
| 1 Å/s* | 395 MPa | 5 MPa | 50 nm, 190 nm | Average calculated for two films |
The stress measurements presented in the table were performed the same day as the deposition.
* Before changing the deposition rates to 15 Å/s or 1 Å/s first contact responsible Danchip staff. These deposition rates are not recommended for all thicknesses and applications.
Time dependence
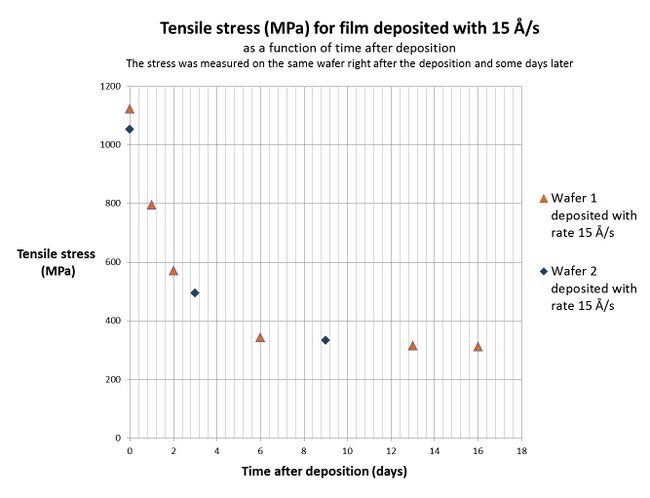
Further it was seen that the stress in the films decreases with time.
The stress in the Ni films deposited with 15 Å/s was measured on the same wafer at different occasions, both directly after the depositions were done and some days later. The data is presented in the graph below, where it is seen that the film stress decreased over time.

