Specific Process Knowledge/Characterization/XPS/Processing/Basics/2highres: Difference between revisions
| Line 1: | Line 1: | ||
== | == Selecting high resolution spectra for peak fitting == | ||
The analysis of the data from [[Specific Process Knowledge/Characterization/XPS/Processing/Basics/1intro|here]] is continued. Open a new data grid and drag the four sets of spectra into each quadrant as seen below. | The analysis of the data from [[Specific Process Knowledge/Characterization/XPS/Processing/Basics/1intro|here]] is continued. Open a new data grid and drag the four sets of spectra into each quadrant as seen below. | ||
Revision as of 09:08, 9 September 2015
Selecting high resolution spectra for peak fitting
The analysis of the data from here is continued. Open a new data grid and drag the four sets of spectra into each quadrant as seen below.

Scroll up or down through the levels of one spectrum by using the scroll button (either etch level or etch time). If several spectra are selected simultaneously by pressing SHIFT or CTRL while clicking on the spectra in the four quadrant view, you watch the evolution of the spectra together.
To analyze a single spectrum, select and maximize it. Before adding peaks to the spectrum, it is a good idea consider what you know about the sample. Here, we know that the sample has ALD deposited layers of ZnO and CuZn on top of a silicon substrate. One would therefore expect to see bulk silicon provided we sputter deep enough and oxidized silicon from the native oxide. Therefore, scroll to a level where, preferably, both the oxidized Si2p and the bulk silicon Si2p are visible. In this case, it is level 35.
-
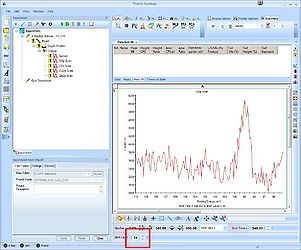 Level 34: The oxide peak is barely visible.
 -
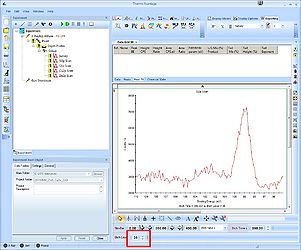 Level 35: Both the oxide and the bulk peak are visible and clearly separated.
 -
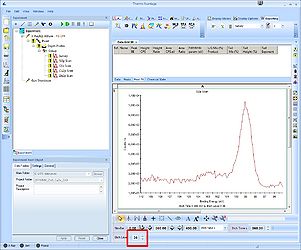 Level 36: The separation between the peaks is less visible.


Click the 'Peak Fit' button in the top to enable peak fitting on all levels.

A window with a suggestion to a peak will pop up. In the spectrum the location and width of the peak is shown