Specific Process Knowledge/Thin film deposition/Deposition of Titanium Nitride/Deposition of Titanium Nitride using Lesker sputter tool: Difference between revisions
| Line 570: | Line 570: | ||
===DC power 110W=== | ===DC power 110W=== | ||
At low power, the metallic response (negative values of ) can be observed in the pressure range below 3mTorr, although only 1 and 2 mTorr can be used in plasmonic applications. | |||
<gallery caption="DC Power 110W" widths="800px" heights="400px" perrow="1"> | <gallery caption="DC Power 110W" widths="800px" heights="400px" perrow="1"> | ||
Revision as of 14:57, 15 April 2020
Deposition Characteristics
This page presents the results of TiN deposition using reactive sputtering by Lesker sputter tool. The source is Ti, and the reactive gas is N2. The fabrication and characterization were conducted in 2019 by Evgeniy Shkondin, DTU Nanolab. The prepared samples were investigated by X-ray Photoelectron Spectroscopy (XPS) and Spectroscopic Ellipsometry. Several parameters influences the quality of the films. The analysis included variations of power, pressure, substrate temperature and N2/Ar ratio.
In short, the key to prepare high quality, stochiometric, conducting TiN layers is to apply the following deposition parameters:
- Before TiN deposition on the working wafer, always do pre-sputtering of Ti without N2 for around 2-3 min with the same power and pressure as desired for TiN.
This will clean the target and decrease the level of moisture in the chamber.
- High power in the range 220W-250W
Lesker sputter tool uses 2-inch targets. For Ti source, the highest allowed power is 250W. Deposition rate increases by using high power and it lowers the incorporation of oxygen in the film.
- Low pressure (1-2 mTorr)
Lowering the pressure improves stochiometry and lowers the oxygen content.
- High substrate temperature (400°C)
Generally, the substrate temperature affects the density.
- Work with N2 concentration in the range 20-50%
The higher the nitrogen concentration the lower the deposition rate, and it will lead to problems with respect to oxygen contamination.
The investigation is based on two powers - 110W and 220W in the pressure range between 1 to 14 mTorr. The substrate temperature was kept at 400°C with N2/Ar ratio 20/80%.
Spectroscopic Ellipsometry
The spectroscopic ellipsometry measurements were conducted by using VASE Ellipsometer. The purpose of the investigation is to see how the change in deposition power and pressure affects the shape of the dielectric function. Other parameters - such as layer thickness were also extracted.
Drude-Lorentz model
Drude-Lorentz is commonly used to fit TiN complex dielectric function.
where:
is a high-frequency dielectric constant.


The Drude term can be written as follow:
where:
- dielectric permittivity of vacuum,
- Planck constant,
- resistivity,
- scattering time.


Lorentz oscillator term is given by:
where:
- number of oscillator,
- Amplitude,
- Broadening of each oscillator,
- Center energy of the Lorentz oscillator.


Dielectric function analysis
| High Power. Deposition time: 20min. Substrate temperature - 400°C | Drude term | Lorentz oscillator - 1 | Lorentz oscillator - 2 | Lorentz oscillator - 3 | ||||||||||
|---|---|---|---|---|---|---|---|---|---|---|---|---|---|---|
| Power (W) | Pressure (mTorr) | Thickness (nm) | (Ohm cm) | (fs) | (eV) | (eV) | (eV) | (eV) | (eV) | (eV) | ||||
| 220 | 1 | 87.01 | 3.489 | 7.5618·10-5 | 1.008 | 192.557054 | 0.0213 | 6.321 | 9.689831 | 2.7132 | 5.604 | - | - | - |
| 220 | 2 | 66.13 | 2.609 | 2.017·10-4 | 1.141 | 2.083940 | 0.8848 | 3.492 | 8.125820 | 3.2412 | 5.944 | 15.781023 | 0.9923 | 1.053 |
| 220 | 4 | 66.40 | 1.934 | 6.6567·10-4 | 1.041 | 2.439534 | 1.3777 | 3.724 | 4.677488 | 4.0837 | 6.160 | 12.110575 | 0.9458 | 0.959 |
| 220 | 6 | 75.11 | 1.347 | 2.587·10-3 | 0.655 | 2.303432 | 1.7123 | 3.942 | 1.934678 | 5.4051 | 6.420 | 7.712139 | 0.9659 | 0.883 |
| 220 | 8 | 81.94 | 1.271 | 4.273·10-3 | 0.242 | 2.038004 | 1.7074 | 4.062 | 1.614453 | 5.6564 | 6.677 | 5.212949 | 0.8602 | 0.895 |
| 220 | 10 | 82.59 | 1.138 | 5.257·10-3 | 0.323 | 1.672949 | 1.6265 | 4.186 | 1.433617 | 7.9416 | 7.058 | 4.294563 | 0.8546 | 0.902 |
| 220 | 12 | 82.40 | 1.090 | 5.807·10-3 | 0.443 | 1.450316 | 1.5414 | 4.262 | 1.368362 | 9.1405 | 7.128 | 3.787770 | 0.8471 | 0.906 |
| 220 | 14 | 81.88 | 1.089 | 5.838·10-3 | 0.468 | 1.415215 | 1.5370 | 4.266 | 1.349390 | 9.2650 | 7.074 | 3.579245 | 0.8420 | 0.909 |
| Low Power. Deposition time: 40min. Substrate temperature - 400°C | Drude term | Lorentz oscillator - 1 | Lorentz oscillator - 2 | Lorentz oscillator - 3 | ||||||||||
| Power (W) | Pressure (mTorr) | Thickness (nm) | (Ohm cm) | (fs) | (eV) | (eV) | (eV) | (eV) | (eV) | (eV) | ||||
| 110 | 2 | 37.28 | 1.951 | 3.4619·10-4 | 0.719 | 2.294032 | 2.7712 | 4.298 | 8.807626 | 4.6007 | 7.311 | 14.494131 | 1.0222 | 1.025 |
| 110 | 4 | 32.42 | 2.024 | 9.724·10-4 | 0.890 | 5.185267 | 3.5747 | 4.958 | 7.900142 | 2.2325 | 7.115 | 12.284271 | 0.8444 | 1.012 |
| 110 | 6 | 34.12 | 1.907 | 2.109·10-3 | 1.119 | 3.946173 | 3.4395 | 4.953 | 4.368733 | 1.9486 | 7.189 | 7.063107 | 0.8046 | 0.983 |
| 110 | 8 | 35.58 | 1.694 | 2.661·10-3 | 1.292 | 2.990718 | 3.3861 | 4.928 | 3.091825 | 2.0160 | 7.163 | 4.843337 | 0.7813 | 0.980 |
| 110 | 10 | 37.02 | 1.526 | 2.741·10-3 | 1.592 | 2.521075 | 3.5788 | 4.959 | 2.664635 | 2.1239 | 7.295 | 3.751751 | 0.7497 | 0.975 |


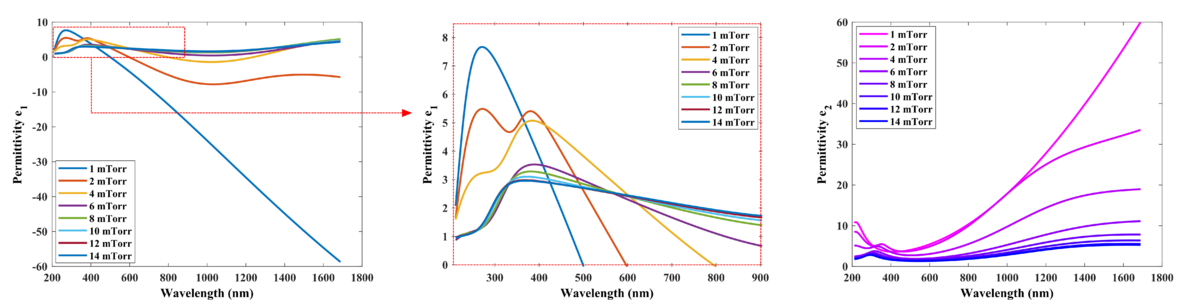
Dielectric function can be rearranged in order to separate real and complex parts: . Here, is a real part of the permittivity, and is imaginary part describing optical losses.


Process power and pressure is extremely important values since the slightest deviation will change the TiN optical performance. The clear metallic behavior is observed at lowest pressure and the highest power. Decreasing the power and/or increasing the process pressure will change the metallic state into oxynitride and oxide phase response.
DC power 220W
At this power, the metallic response (negative values of ) can be observed in the pressure range below 3mTorr, although only 1 and 2 mTorr can be used in plasmonic applications.
- DC Power 220W

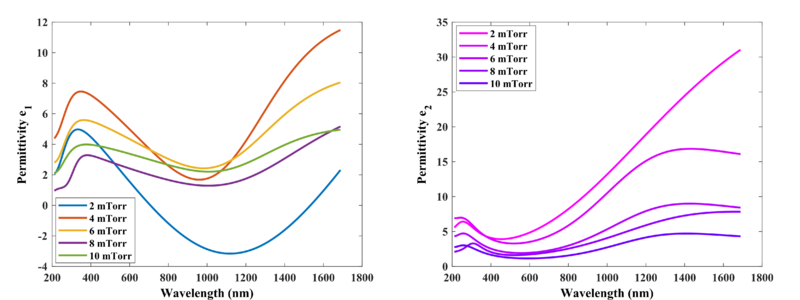
DC power 110W
At low power, the metallic response (negative values of ) can be observed in the pressure range below 3mTorr, although only 1 and 2 mTorr can be used in plasmonic applications.
- DC Power 110W

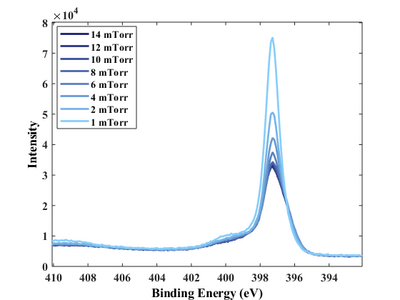
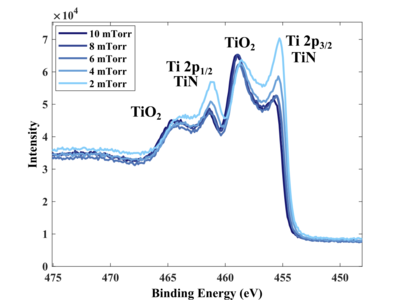
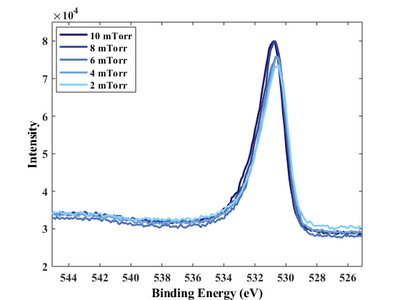
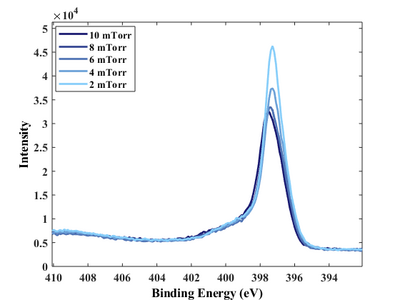
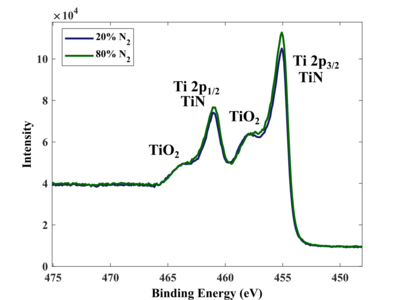
XPS analysis
XPS measurements of all samples has been performed using ….
High resolution scans of individual elements
DC power 220W
- DC Power 220W
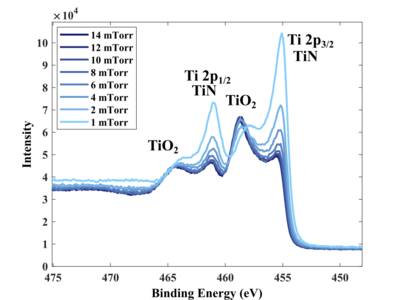
Ti 2p scan.
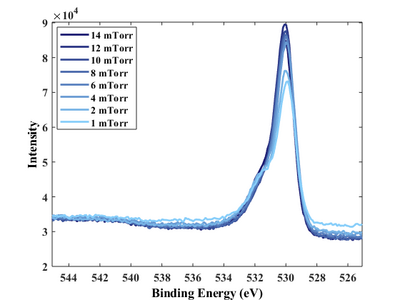
O 1s scan.
N 1s scan.


DC power 110W
- DC Power 110W
Ti 2p scan.
O 1s scan.
N 1s scan.


Stochiometry and N2/Ti ratio
- Stochiometry
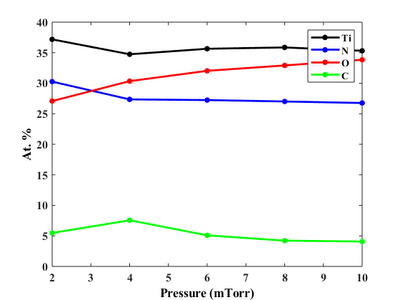
Elemental procent presence as a function of process pressure (110W).
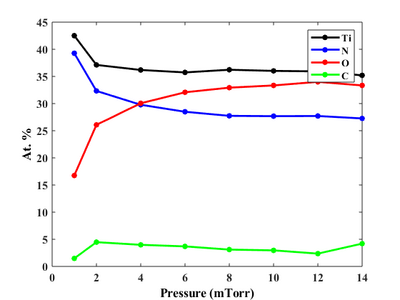
Elemental procent presence as a function of process pressure (220W).
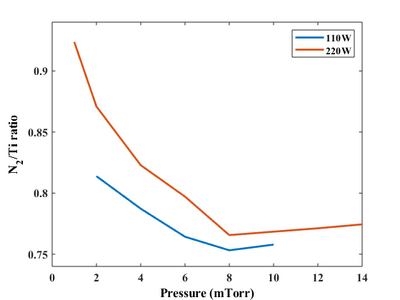
N/Ti ratio for 220W and 110W deposition power.


Films elemental composition
Atomic concentration......
| Power (W) | Pressure (mTorr) | Ti (At. %) | N (At. %) | O (At. %) | C (At. %) |
|---|---|---|---|---|---|
| 220 | 14 | 35.20 | 27.26 | 33.34 | 4.20 |
| 220 | 12 | 35.93 | 27.71 | 34.00 | 2.36 |
| 220 | 10 | 36.02 | 27.68 | 33.34 | 2.96 |
| 220 | 8 | 36.23 | 27.74 | 32.93 | 3.10 |
| 220 | 6 | 35.74 | 28.49 | 32.08 | 3.69 |
| 220 | 4 | 36.19 | 29.78 | 30.05 | 3.98 |
| 220 | 2 | 37.12 | 32.33 | 26.08 | 4.47 |
| 220 | 1 | 42.51 | 39.27 | 16.75 | 1.48 |
| 110 | 10 | 35.31 | 26.76 | 33.84 | 4.08 |
| 110 | 8 | 35.86 | 27.01 | 32.91 | 4.22 |
| 110 | 6 | 35.64 | 27.24 | 32.03 | 5.09 |
| 110 | 4 | 34.74 | 27.35 | 30.34 | 7.56 |
| 110 | 2 | 37.18 | 30.26 | 27.08 | 5.48 |
Effect of substrate temperature
| High Power. Deposition time: 10min | Drude term | Lorentz oscillator - 1 | Lorentz oscillator - 2 | Lorentz oscillator - 3 | |||||||||||
|---|---|---|---|---|---|---|---|---|---|---|---|---|---|---|---|
| Temperature (oC) | Power (W) | Pressure (mTorr) | Thickness (nm) | (Ohm cm) | (fs) | (eV) | (eV) | (eV) | (eV) | (eV) | (eV) | ||||
20 |
220 | 2 | 41.06 | 2.574 | 6.5701·10-4 | 0.815 | 5.851313 | 6.8806 | 6.711 | 14.513401 | 1.0293 | 1.038 | - | - | - |
400 |
220 | 2 | 46.09 | 2.692 | 2.1618·10-4 | 0.697 | 1.087128 | 1.3685 | 3.824 | 8.301574 | 3.5998 | 6.291 | 10.301534 | 1.0371 | 1.104 |
- Effect of substrate temperature. Deposition time 10 min. Power 220W. Pressure 2 mTorr
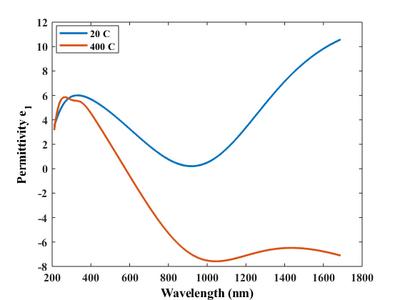
Real part of permittivity (220W, 2 mTorr).
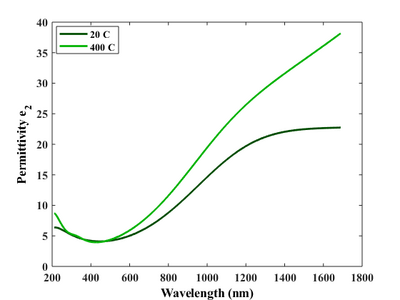
Imaginary part of permittivity (220W, 2 mTorr).


Effect of N2/Ar ratio
| High Power. Deposition time: 20min | Drude term | Lorentz oscillator - 1 | Lorentz oscillator - 2 | Lorentz oscillator - 3 | |||||||||||
|---|---|---|---|---|---|---|---|---|---|---|---|---|---|---|---|
| N2 (flow (%)) | Power (W) | Pressure (mTorr) | Thickness (nm) | (Ohm cm) | (fs) | (eV) | (eV) | (eV) | (eV) | (eV) | (eV) | ||||
20 |
220 | 1 | 87.01 | 3.489 | 7.5618·10-5 | 1.008 | 192.557054 | 0.0213 | 6.321 | 9.689831 | 2.7132 | 5.604 | - | - | - |
80 |
220 | 1 | 39.88 | 1.926 | 1.6566·10-4 | 0.761 | 7.288805 | 4.9948 | 6.061 | 48.12146 | 0.5020 | 0.442 | - | - | - |
- Effect of substrate temperature. Deposition time 10 min. Power 220W. Pressure 2 mTorr
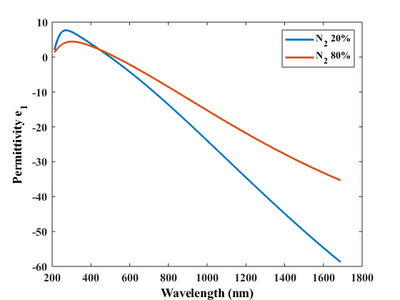
Real part of permittivity (220W, 2 mTorr).
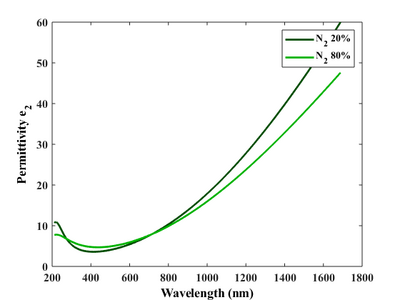
Imaginary part of permittivity (220W, 2 mTorr).
Elemental procent presence as a function of process pressure (110W).


