Specific Process Knowledge/Etch/DRIE-Pegasus/picoscope
Feedback to this page: click here
Process optimization using the Picoscope
Unless otherwise stated, all content on this page was created by Jonas Michael-Lindhard, DTU Nanolab
Before going into details on why it makes sense to optimize the processes using the picoscope process monitoring, we need to have a look at how monitoring processes is usually done.
Standard process parameter monitoring
The original standard recipes on Pegasus 1 differ in many ways. Here, we go through two of them.
Process A
The process parameters of the second step of Process A is listed in the table below:
| Process A Step 2 parameters | ||
|---|---|---|
| Parameter | Etch | Dep |
| Gas flow (sccm) | SF6 350 (1.5 s), 550 | C4F8 200 |
| Cycle time (secs) | 7.0 | 4.0 |
| Pressure (mtorr) | 25 (1.5 s), 150 | 25 |
| Coil power (W) | 2800 | 2000 |
| Platen power (W) | 140 (1.5) 45 | 0 |
| Common | Temperature 20 degs | |
When running any recipe on the SPTS Pro software, a set of process parameters are recorded as the process runs. This data can be accessed later by looking up the datalog. Which parameters are recorded is dictated by the so-called logging recipe that is selected for every process recipe. The list of possible parameters to include in a logging recipe is long and is comprised of both input parameters such as 'Coil forward power demand' and 'SF6 flow setpoint', and measured values such as 'Platen temperature' and 'Platen DC Bias'. During the process itself, one can also activate the 'Trace' to monitor the process parameters in real time.
To the left in the figure below, some of the most important process parameters are shown for a process run of the recipe Process A. A total of four cycles are shown with each cycle separated by white vertical lines.
- 4 cycles of Process A
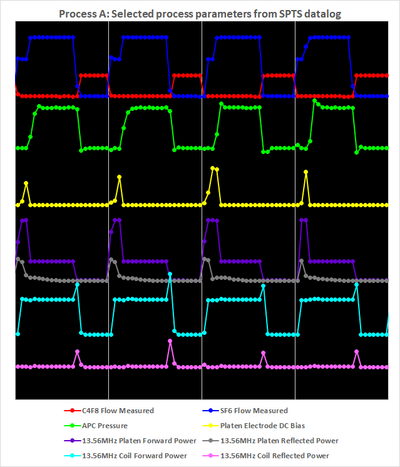
Left: Recorded with the SPTS software

Right: Recorded with the Picoscope


Above to the left, one can see the multiplexing of the Bosch process by alternation of the gas flows of SF6 (that has flow initially at 350 sccm in the break for the first 1.5 second then 550 sccm for 5.5 seconds in the main etch phase) and C4F8 (at 200 sccm in the dep phase) according to the process recipe table above. Below, the Pressure alternates between 25 mtorr (dep and break) and 150 mtorr (main). The Platen Electrode DC Bias (the electrostatic potential difference between the plasma and the wafer electrode that drives the ion bombardment in the etch process) is generated by the Platen Power at 140 W in the break and 45 W in the main etch. Below this, the Reflected Platen Power is not zero. The Coil Power is 2800 W (etch) and 2000W (dep) with the Reflected Coil Power below. The spikes in Coil Power at every point where the Reflected is not zero indicates that the Coil Power is running in Load mode (as opposed to Forward mode) where the power lost as reflected power is compensated for by increasing the input power.
Process A has 4 second dep phase and 7 second (1.5 second break and 5.5 second main) and the SPTS Pro software samples the process parameters every 0.5 second. This produces plots as seen above to the left where all measurements have markers. One can ask the questions:
- What happens if the cycle duration is lowered in order produce smaller scallops?
- How do we know if something that is very brief happens? For instance, spikes in reflected power can be rather short lived as indicated by the one point spikes of reflected coil power above.
In both cases, the sampling rate 2 samples per second is simply not high enough - we need to increase this. The SPTS Pro software can only lower this. However, realizing that all the devices (mass flow controllers, pressure gauges, RF generators etc.) responsible for the parameters in the plot above are producing output measurements in real time, we can sample these parameters by probing them with some external device. Enter the Picoscope oscilloscope with 8 analog channels that enable us sample up to 8 outputs, usually a DC voltage, at almost any sampling rate. Unlike the old oscilloscopes, the Picoscope is fully operated by a software that produces a vast amount of data and nice plots. We therefore have to decide which process parameters are the most important to monitor and then go through the electrical diagrams to find an appropriate place to pick up the signal. This set of parameters is chosen as shown in the plots above.
Comparing the two plots we observe the following:
- There is, indeed, short lived incidences that are not picked up by the SPTS Pro software:
- Spikes of high flow when the C4F8 MFC opens.
- Spikes of reflected coil power.
- The reading of the DC Bias has much more detail than the one-point reading of the Pro software indicates.
- There are oscillations in the pressure every time whenever there is a change of gas flow
Since Process A is a standard recipe we will not change it as it is. Before deciding what to do we'll have a look at another recipe with shorter cycles.
Process D4
After a few years in its original configuration, we decided to upgrade Pegasus 1 to improve the fast switching performance. As a result, the original recipe Process D was changed to Process D4 with faster cycles. The process parameters are listed in the table below.
| Process D4 | ||
|---|---|---|
| Parameter | Etch | Dep |
| Gas flow (sccm) | SF6 275, O2 | C4F8 150 |
| Cycle time (secs) | 2.2 | 1 |
| Pressure (mtorr) | 26 | 20 |
| Coil power (W) | 2500 | 2000 |
| Platen power (W) | 35 | 0 |
| Common | Temperature 0 degs | |
Running Process D4 while monitoring with the Pro software and Picoscope produces plots as shown below.
- 4 cycles of Process D4

Left: Recorded with the SPTS software
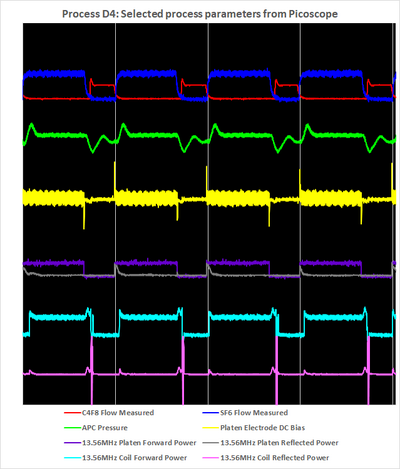
Right: Recorded with the Picoscope


Comparing to Process A we observe several things:
- The shorter cycle times (Process A has 11 seconds full cycle and Process D4 has 3.2 second full cycle) emphasize the need for the faster process parameter sampling rate. For instance, a dep cycle with one measurement point for the C4F8 flow is no good.
- The oscillations in pressure now last the entire dep cycle - it never stabilizes.
- Optimizing a recipe to arrive at a minimum reflected power, for both coil and platen, using the Pro software datalogging may be somewhat illusory as it only picks up a fraction of the spikes occurring at every change of plasma conditions.
What to do about this?
How to improve this
Minimizing the reflected power is essential to ensure that the instrument hardware doesn't degrade over time and that the users have accurate information about the processes. Realizing that there may be a challenge with detecting reflected powers we need to decide what to do. We can abandon all processes and start developing new ones - this will halt all processing. Instead, a set of new recipes will be developed.
Stabilize the pressure
Changing the pressure in the plasma has a great impact on the RF matching conditions as illustrated for an oxygen plasma elsewhere. The obvious place to start is therefore the pressure. Also, it barely makes sense to claim that the pressure is 20 mtorr in the dep phase if it oscillates as shown for the Process D4 above.
Compared to many other vacuum systems the pegasus tools require a massive turbo pump to cope with the large gas flows and to be able to provide fast pump-down times. Since turbo pumps cannot change its frequency, the pumping speed is constant. The pressure in the process chamber is therefore regulated by the throttle valve or APC (Automatic Pressure Valve) that sits in front of the turbo pump. It is capable of adjusting the opening towards the turbo pump - and does so very fast and very precisely. If a process is running with some setting of gas flows, RF powers etc., the pressure is then adjusted by opening/closing the APC.
The processes A and D4 have fixed pressure settings. This means that when transitioning from one phase (with a certain gas flow, RF powers and pressure) to another phase at, say, the same total gas flow and RF powers but with lower pressure, the APC will open up more than what is required to reach the new pressure in order to arrive there faster. When the pressure reading passes the new setting, the valve will close up too much. This feedback loop produces the pressure oscillations seen in plots above. It works just like PID tuning.
To get rid of the oscillations we must change from the Fixed pressure mode must to Fixed APC mode. Here, this is no feedback loop: In the transition between phases, the different gas flows, RF powers and APC setting will produce a different pressure that is reached without any overshooting. The price one may have to pay is that the new pressure may be reached at a slower speed. Also, with a pressure setting defined in terms of APC percentage in the recipe, the actual pressures during the process itself will have to be noted manually.
Picoscope GUI
Using the Picoscope is straightforward. The Start/Stop recording buttons are located in the lower left corner of the GUI; the recording has to be done manually. Below is a typical screen dump of the GUI from a process run.

The settings for the channels are listed below:
| Channel | Label | Measurement | Measurement range |
|---|---|---|---|
| Fixed | Fixed | Fixed | Adjustable |
| A | SF6 flow | DC voltage | ± 10V |
| B | C4F8 flow | DC voltage | ± 20V |
| C | Pressure | DC voltage | ± 10V |
| D | DC Bias | DC voltage | ± 2V |
| E | Platen Power | DC voltage | ± 50V |
| F | Reflected Platen Power | DC voltage | ± 50V |
| G | Coil Power | DC voltage | ± 20V |
| H | Reflected Coil Power | DC voltage | ± 10V |
One can adjust several parameters:
- Collection time, red frame: Here, it is 5 seconds per division, can also be 10 seconds per division
- Number of samples, green frame: The lowest sampling rate (50 S) is still much, much faster than the SPTS Pro software.
- Waveform Buffer Index, blue frame: The number of screens with data in the current recording. If stopped, scroll back and forth by pressing the Next and Previous buttons (blue triangular buttons behind the blue frame).

The Picoscope exports to a variety of datafiles:
- ps file: Internal format, the data may be opened/edited later.
- csv file: Exports to Excel
- gif file: Exports to a number of gif files which are great for illustrations in LabAdviser
- animated gif file: Contains all gif files in one file
The picoscopes installed on Pegasus 1, 2 and 3 all have the same setup.
Optimizing recipes with Picoscope
Continuous processes do not benefit from the Picoscope in the same way that Bosch processes do. This is why a Picoscope has not been installed on Pegasus 4 that runs continuous etch processes of dielectrics. For the Bosch processes, however, the situation is different. Optimizing multiplexed processes without the Picoscope now feels somewhat like studying the night sky with the naked eye compared to using a telescope. So many details in the etch processes are invisible without the Picoscope that it becomes meaningless to optimize Bosch processes without it.
The downside of having a much more detailed view of the process is that it is very time consuming to arrive a minimum of reflected powers. Small changes in setpoints of the matching units can have dramatic impact. Quite often it is necessary to introduce shoulders on changes in gas flows to soften the transition in plasma conditions. As a result, the number of necessary parameters in the recipes increases a lot. Below is a few variation of the socalled DREM (see publications in the list below) recipes. All RF matching setpoints are as important as any other parameter.
| Recipe | General | Pressure | Gases | Generators | Matching | Tem- pera- ture | Results | |||||||||||||||||||||||||||||||||||||
|---|---|---|---|---|---|---|---|---|---|---|---|---|---|---|---|---|---|---|---|---|---|---|---|---|---|---|---|---|---|---|---|---|---|---|---|---|---|---|---|---|---|---|---|---|
| C4F8 | SF6 | Ar | Coil | Platen | Coil | Platen | ||||||||||||||||||||||||||||||||||||||
| Platen | Stb | S/E | Dp | Et | Cyc | Dp | Et | Dp | Et | Dp | Et | Dp | Et | Dp | Et | Dp | Et | Dp | Et | Dp | Et | Runs | Keywords | |||||||||||||||||||||
| U/D | H/L | D | B | M | D | B | M | D | B | M | D | B | M | D | B | M | D | B | M | D | B | M | L | T | L | T | L | T | L | T | ||||||||||||||
| DREM 3kW 100% | Pump to base, Clamp Substrate, preset matching unit step | 1 | ||||||||||||||||||||||||||||||||||||||||||
| U | HF | 5s | D/E | 1 | 4 | - | 100% | 100% | 400 | 5 | 0.3@200 | 15 | 1.1@15 | 0.3@200 | 900 | 200 | 3@250,250 | 3 | 3 | 0 | 0.6@1 | 05@300 | 0.1 | 40 | 50 | 40 | 50 | 38 | 53 | 38 | 53 | -19 | ||||||||||||
| DREM 3kW 100% a | Pump to base, Clamp Substrate, preset matching unit step | 1 | ||||||||||||||||||||||||||||||||||||||||||
| U | HF | 5s | D/E | 1 | 4.1 | - | 100% | 100% | 400 | 5 | 0.3@200 | 15 | 1.2@15 | 0.3@200 | 900 | 200 | 3@250,250 | 3 | 3 | 0 | 0.6@1 | 0.6@300 | 0.1 | 40 | 50 | 40 | 50 | 38 | 53 | 38 | 53 | -19 | ||||||||||||
| DREM 3kW 100% b | Pump to base, Clamp Substrate, preset matching unit step | 2 | ||||||||||||||||||||||||||||||||||||||||||
| U | HF | 5s | D/E | 1.1 | 4.1 | - | 100% | 100% | 400 | 5 | 0.3@200 | 15 | 1.2@15 | 0.3@200 | 900 | 200 | 3@250,250 | 3 | 3 | 0 | 0.6@1 | 0.6@300 | 0.1 | 40 | 50 | 40 | 50 | 38 | 53 | 38 | 53 | -19 | ||||||||||||
New recipes
It was professor Henri Jansen at DTU Nanolab who came up with the idea of adding the Picoscope to the Pegasi tools. Since then his group has researched a lot into its possibilities. Below is a list of publications in which the Picoscope plays a crucial role:
- Bingdong Chang et al.
- DREM: Infinite etch selectivity and optimized scallop size distribution with conventional photoresists in an adapted multiplexed Bosch DRIE process
- 2018 Microelectronic Engineering Volume 191, 5 May, Pages 77-83
- https://doi.org/10.1016/j.mee.2018.01.034
- Bingdong Chang et al.
- DREM2: A facile fabrication strategy for freestanding three dimensional silicon micro- and nanostructures by a modified Bosch etch process
- 2018 J. Micromech. Microeng. 28 105012
- https://doi.org/10.1088/1361-6439/aad0c4
- Vy Thi Hoang Nguyen et al.
- The CORE Sequence: A Nanoscale Fluorocarbon-Free Silicon Plasma Etch Process Based on SF6/O2 Cycles with Excellent 3D Profile Control at Room Temperature
- 2020 ECS J. Solid State Sci. Technol. 9 024002
- https://doi.org/10.1149/2162-8777/ab61ed
- Bingdong Chang et al.
- Large Area Three-Dimensional Photonic Crystal Membranes: Single-Run Fabrication and Applications with Embedded Planar Defects
- 2019, Advanced Optical Materials Volume 7, Issue 2, pp. 1801176
- https://doi.org/10.1002/adom.201801176
- Chantal Silvestre et al.
- Deep reactive ion etching of ‘grass-free’ widely-spaced periodic 2D arrays, using sacrificial structures
- 2020, Microelectronic Engineering, Volume 223, 15 February, 111228
- https://doi.org/10.1016/j.mee.2020.111228