Specific Process Knowledge/Etch/DRIE-Pegasus/Using OES to monitor etch process
Feedback to this page: click here
* This work was done by Henri Jansen and Bingdong Chang in 2017;
* This page was edited by Bingdong Chang 23 October 2017.
An optical endpoint detection system is installed on DRIE-Pegasus, which can be used to monitor an etch process in situ (either a continuous process or a Bosch process). This real time monitoring is realized by identifying the light emitted from different plasma species corresponding to different wavelengths, which is known as optical emission spectroscopy and can give a lot of information regarding etching chemistry and chamber conditions. Another strategy is to use optical endpoint detection system as an optical emission interferometer, which can be generated either by a changing thickness of a thin film (e.g. fluorocarbon layer or photoresist), or by high contrast gratings formed during etching process.
An introduction of how to use OES system can be found here. Below are some examples of applications of OES in different processes:
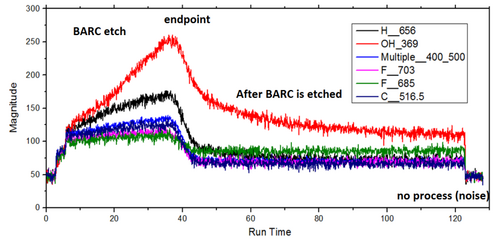
Here is an example of OES signals when oxygen plasma is applied to remove BARC layer. After DUV lithography, an oxygen plasma is normally used to open the BARC layer, so the etch process can start directly on the silicon surface. However, the DUV resist layer will also be consumed when oxygen plasma is applied, thus the maximum etch depth will be limited, and the critical dimension of pattern can also be changed. By monitoring the -OH channel on OES at 369nm, we can have an idea about when the BARC layer is fully opened.
- OES signals during BARC etch process

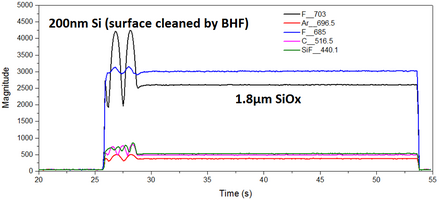
Another example is by using optical emission interferometer to monitor the etch of SOI wafers. Since the overetch into oxide layer can give issues, such as notching, thus it is always good to know if the silicon is fully etched or not. By looking at signals from different wavelengths, we can calculate how much silicon is etched by simple interference condition.
- OES signals during SOI etch process

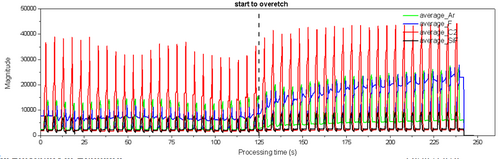
Bosch process can also be monitored by OES, and we can retract information such as overetch, changing of resist thickness, etch depth, etc. Here is the OES signals, notice the increasing intensities of -F channels, which indicates the resist is totally consumed and silicon starts to be overetched.
- OES signals during Bosch etch process

For more information, please contact Henri Jansen (henrija@dtu.dk) or Bingdong Chang (bincha@dtu.dk)