LabAdviser/314/Microscopy 314-307/Technique/X-ray spectroscopy/EDS-SEM
Feedback to this page: click here
(content by Berit Wenzell @DTU Nanolab, April 2020)
EDS-SEM Quick Guide
- 1) Link the working distance (WD) and bring Z-height to 10mm WD
- 2) Launch Aztec and save the file on the shared drive
- 3) Insert EDS detector
- 4) Select high-voltage (HV)
- Select an accelerating voltage that is 2-3x higher than the energy characteristic X-ray you want to generate from the element with the highest atomic number (Z)
- Could be 15kV for silicates…, 20kV for metal
- 5) Select operating mode
-
- Point & ID: acquire image, select a point or area of interest for analysis
- Mapping: elemental distribution in region of interest
- Optimization: calibrate if needed – see below if needed.
- 6) Select process time
-
- High number – good energy resolution
- Low number – good counting statistic
- Could be 5 for Point & ID 2 for Mapping
- 7) Bring the dead time to 30 – 50 %
- Change the dead time by changing the beam current (spot or aperture)
- The beam current cannot be higher than what the sample allows, to avoid charging and beam damage. To avoid beam induced effects, accept a low dead time and count for a longer time.
- If the dead time is 100% turn off the CCD.
- 8) Aztec software
- Use the software to acquire data and process data.

- Fill out the settings from left to right. Acquire image, spectrum. Process the data.
- 9) After use, retract the detector
EDS-SEM Quick Guide - Explained
1) Link the working distance (WD) and bring Z-height to 10 mm WD
Focus on the surface of the sample at 2000x magnification or higher to find the true working distance (WD) at a given stage height and given sample height. Press the button with the red question mark to links the working distance with the movement of the sample stage along the z-axis. The z-coordinate switches between showing the distance of how much the stage has moved up and the working distance.
Bring the stage to a 10mm working distance, by setting the z-coordinate to 10mm.
Different microscopes have different optimal setting for the EDS.
Too short WD: the pole piece or backscatter detector might shadow for the X-rays.
Too long WD: the matrix correction used for quantification and correction for the internal Si fluorescence peak from the detector might be wrong.
If your sample is not flat: focus on the highest point to avoid damaging the pole piece or the backscatter detector. However, you no longer remain in a 10mm working distance when moving away from the linked coordinate.
Double click on the Aztec button to launch the Aztec software. ![]()
You will be prompted to either open an existing project or to create a new project. Save the project as an “Aztec project” by selecting “file” and save as a project. Browse the file pathway and find the shared folder. The project files will automatically be saved into this folder.
Important: Do not use your personal login on the support-pc, otherwise the EDS detector will lose connection to the microscope-pc. After acquiring data, the Aztec software can be found on different computers in 314 and 307, which means microscope time is not needed to process the data.
3) Insert EDS detector
Setup the EDS detector by using the control window found at the bottom right corner of the screen.

- 1) Select the button that looks like an EDS detector
- 2) Go to the “Position” tab/window
- 3) Insert EDS detector into the chamber, by pressing the “In” button
The EDS detector moves into the chamber
- 4) Go to the “thermal” tab/window
- 5) Switch EDS from “standby” into “operating” mode
- 6) Wait until the detector is ready
4) Choose accelerating voltage (HV)
To generate X-ray photons an ionization event is required. The minimum energy to produce an ionization event has a critical ionization energy (Ec). The critical ionization energy is different for each shell and subshell. Inner shell electrons (K) have highest Ec. If the incident beam energy has a high enough energy to excite K shell electrons, it can excite X-rays from all the other shells. Select the accelerating voltage 2-3x higher than the energy of the X-ray, you want to generate. In other terms, the overvoltage (U) should be around 2.4 to have the optimal accelerating voltage/electron energy of the primary beam/energy of electrons leaving the gun (E0).

Example: Analysis of a sample, where the element with highest energy that need to be analyzed is:
FeKα: 6.4 keV
Select acceleration voltage:

Without sufficient overvoltage, X-ray production is drastically reduced.

Too high accelerating voltage: the size of the interaction volume will increase. That means huge correction for absorption, especially for the low energy lines and fluorescence for high energy, leads to a big error. For high accelerating voltage you need to consider the risk of beam damage.
Too low accelerating voltage: you might not have enough energy to kick out an electron from the inner shells. In Figure 1, the overvoltage for Ni is very low, resulting in a very small peak. The counting statistic becomes very poor for Ni at that low HV, even though Ni is present in very high concentration.
When analyzing small features, the beam voltage needs to be reduced to avoid generation of X-rays from surrounding material. However, at low kV only low energy lines are available for analysis. When working at 20 kV, the separation of widely spaced K lines of Cr, Fe and Ni, will not be affected much by a few eV variations in resolution. However, when working at 5 kV the identification relies on L lines, which are very close in energy. The primary-beam electrons lose energy and change direction due to inelastic scattering within the sample. Some of the lost energy is converted to X-rays, which have a range of energies, from ~0 eV up to E0 (electron energy of the primary beam). Bremsstrahlung X-rays cannot have energies greater than the energy of the electrons in the primary beam so this energy forms the upper energy limit of the X-ray spectrum and is known as the Duane-Hunt limit. That means if you are running at 20kV the background/bremsstrahlung will fade out at 20keV. If the sample is charging, the electrons from the gun are decelerated. The electrons hit the surface of the sample at a lower energy than E0. This means, that matrix correction, background etc, will be wrong.
5) Select operating mode
From the EDS dropdown menu select 1 out of 4 different scan options available.

Point & ID
Quickly analysis composition at a specific point or across a region of interest. Both qualitative, chemical identification, quantitative normalized or unnormalized analysis are possible with or without standards.
Linescan
Determines the concentration of elements across a user-defined line.
Mapping
The beam scans over a selected area to find the elemental distribution in the region of interest.
Optimizing
Two calibration methods are available:
Energy Calibration: For accurate identification of peaks (qualitative and normalized quantitative analyses) Energy Calibration is needed. Energy Calibration measures the shift in the position of the spectral peaks and resolution of the system. As the system has very stable electronics, the system only needs to be calibrated once in several months, provided the environmental temperature of the laboratory is fairly stable. A change of a few degrees in the environmental temperature can cause a small shift in the position of peaks. The Energy Calibration method is performed for representative Process times, available energy ranges and number of channels in one operation. This means, if changing any of the settings soon after Energy Calibration was performed, the system does not need to be re-calibrated. For how to perform Energy Calibration, see manual.
Beam Measurement: If you are an expert user, needing more than relative concentrations and require accurate quantitative analysis with un-normalized quantitative analysis results, Beam Measurement is needed. Any change in the microscope settings such as accelerating voltage or lens control will lead to a change in the beam current. Under these circumstances the Beam Measurement method must be performed before accurate quantitative analysis.
- Note the Beam Measurement method does not need to be performed if only interested in: Qualitative Analysis and Normalized Quantitative Analysis. For how to perform Beam Measurement, see manual.
6) Select process time
The Process time (numbers from 1 – 6) is the length of time spent reducing noise from the X-ray signal coming from the ED detector during processing. By selecting different Process times, it is possible to reduce differing amounts of noise. The longer the Process time, the lower the noise. If noise is minimized, the resolution of the peak displayed in the spectrum is improved. In other words, the peak is narrower and it becomes easier to separate or resolve the peak from another peak that may be close by in energy.
For the first look at a specimen, a long process time (5 or 6) should be used to start with in order to not missing any details in the spectrum.
Examples
When identifying peaks closely spaced and overlapping, good peak separation is important. E.g. when looking at the overlap between Mo-L lines and S K-lines.
Another example is the low energy K lines from light elements which is closely spaced with many peaks from L and M lines from elements with higher atomic number. When analyzing a sample at low HV to minimize the size of the interaction volume (looking at low energy lines), a good peak separation is necessary and can be achieved by using a high process time.

When comparing spectrum 27 with spectrum 40 (especially for Al and Si), spectrum 27 has a better energy resolution than spectrum 40. However, spectrum 40 has almost ten times higher count rate. In spectrum 40, an Hg peak is observed, which is actually not present in the sample. This is due to a high count rate, which the system is not able to correct properly for pulse pile up, see below.
When removing noise from the spectrum it will not only improve the peak separation but simultaneously limit the maximum acquisition rate, resulting in a “poor” counting statistic. For some measurements, analyzing for 5 or 30 seconds might not matter. However, when mapping, analyzing for 10 or 60 minutes matters. If mapping/analyzing an unknown sample, it is recommended to use a long process time in order to not miss any detail in the spectrum. However, if mapping certain elements whose main lines do not overlap, the process time can be decreased and the acquisition rate increased by increasing the beam current.
The choice of process time depends on the sample. When lowering the process time, the dead time decreases, which means the beam current can be increased and thereby improving the counting rate. However, if the sample is charging, drifting or beam damage occur, a low beam current is necessary. When “forced” to use a low beam current, using a low process time as well does not make sense. It only makes sense when the beam current can be increased.

Pulse pile-up
Pulse pile-up occurs when two X-rays pulses arrive almost simultaneously that the pulse processor cannot distinguish the signals as separate signals, which results in the two X-rays being measured as one. This is most commonly seen in the spectrum as a sum peak, which appears at the energy equal to the sum of two major peaks at lower energy.
Examples
In the Figure (Pulse pile-up), a Hg peak is observed, which actually is a sum peak of O Kα and Si Kα. In the Aztec software, the spectrum can be viewed with and without pile-up correction. The green curve shows the spectrum before correction for pulse pile-up. The position of the Hg peak was corrected quit a lot, but the peak was not removed completely.
Pulse pile-up can occur with any pair of pulses and continuum X-rays can pile-up with characteristic X-rays to produce a ‘pile-up continuum’ on the high energy side of major peaks. Pile-up of continuum X-rays with other continuum X-rays can cause the background to extend beyond the Duane Hunt limit or landing energy of incident electrons. The continuum artefacts can affect the accuracy of spectrum processing. Uncorrected pulse pile-up can cause a wide variety of analytical errors including element misidentification, inaccurate peak ratios and quantitative results which change with count rate.

The next two figures show spectra of wollastonite (CaSiO3) both without and with pile-up correction, respectively. In the first figure (Spectrum without pile-up correction), the spectrum before pile-up correction shows a peak at ~5.5 keV (Cr Kα’s position), which is a sum peak of Si Kα and Ca Kα. In the second figure (Spectrum without pile-up correction), the spectrum after pile-up correction shows an over correction, where “holes” in the background is observed.
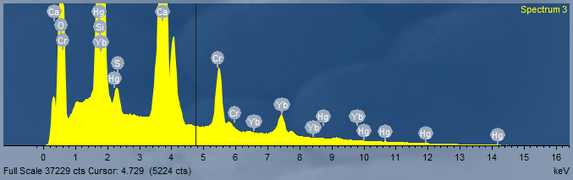
Spectrum without pile-up correction

Spectrum with pile-up correction


7) Bring the dead time to 30-50%
After choosing the process time, look at the dead time and adjust the beam current until it is 30–50%.
Beam current
You can increase the current by increasing the “spot” number, the current through the condenser lenses or by selecting a bigger aperture.
Dead Time
The percentage of time the pulse processor is unavailable for further counting. The ratio between input rate to acquisition rate. The input rate is the rate at which X-rays hits the detector. The acquisition rate is the rate at which the system is processing the counts and formulating the spectrum. Ideally the dead time should be somewhere between 30-70%.
Too high current/dead time: means probability of pile up is high, see above.
Too low current/dead time: means “bad” counting statistic.
8) Aztec Software
Fill out the settings from left to right. Acquire image, spectrum. Process the data.
Point & ID
Qualitative, element identification:
In EDS, the qualitative analysis is the process of identifying elements present in a specimen. It involves acquiring a spectrum from the specimen and then identify the peaks in the spectrum.
A step-by-step guide for qualitative analysis to get the most accurate results out of the system with minimal effort:
Choose an appropriate high voltage, process time, dead time/beam current, see above.
Describe specimen:
The specimen is described and if any knowledge of which elements are present, they can be pre-defined or auto ID is selected.
Scan image:
Acquisition of an image, backscatter-, SE-image etc. Aztec uses the first quadrant of the microscope software.
If the sample is drifting, use AutoLock.
AutoLock
AutoLock is designed to increase the stability of data acquisition on SEMs and TEMs where the image may shift. This image shift can occur for a number of reasons, such as sample movement due to temperature changes at high magnifications or charging of the sample.
It works by acquiring an image, comparing it with a reference image acquired at that Site, determining the image shift and adjusting the scan position to compensate for the shift.
Acquire spectrum

Fill out the settings. For trace elements select a long acquisition time typically 10 to 30 seconds, for major elements a short acquisition time, typically 5 to 30 seconds, is selected.
For process time, see above.
A spectrum can be acquired from an area or point.
Confirm elements:
Confirm which elements are present in the sample. A pre-knowledge about the sample is important if e.g. peak overlap or pile up peaks occur.
To include or exclude an element, double click the element
How to get results:
Select the Report Results and Report Template, where an appropriate template can be selected. It is possible to save the spectrum in different file formats by right clicking the spectrum.

Quantitative, standardless, normalized analysis:
Mapping
9) After use, retract the detector
Retract the EDS detector by using the control window found at the bottom right corner of the screen.
- 1) Select the button that looks like an EDS detector
- 2) Go to the “thermal” tab/window
- 3) Switch EDS from “operating” into “standby” mode
- 4) Go to the “Position” tab/window
- 5) Remove EDS detector from the chamber, by pressing the “Out” button
The EDS detector retracts from the chamber